Figures & data
Table 1. Physical and chemical properties of acid compost tea.
Figure 1. Percentage of phosphorus form contents in different fertilisation treatments.
Note: Data are shown as means of the percentage of different phosphorus forms in each treatment, n = 4. Means followed by the same letter are not significantly different (p ≥ 0.05) based on Tukey test for Duncan. OF, organic matter fertiliser treatment; CT, acid compost tea treatment; HP, phosphoric acid (pH = 1) treatment; CK, no fertiliser treatment. Water-P, Water-soluble phosphorus; NaHCO3-Pi, inorganic phosphorus extracted from NaHCO3; NaHCO3-Po, organic phosphorus extracted from NaHCO3; NaOH-Pi, inorganic phosphorus extracted from NaOH; NaOH-Po, organic phosphorus extracted from NaOH; HCl-P, phosphorus extracted from HCl; Residue-P, phosphorus digested from the residue.
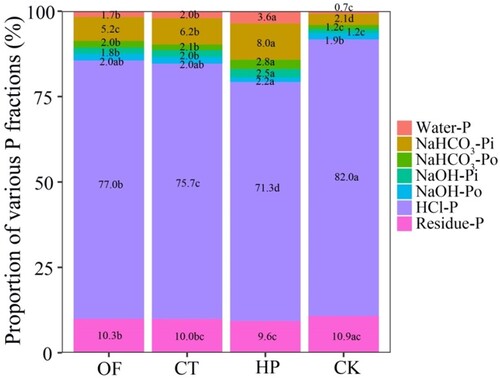
Table 2. Content of various phosphorus forms in different fertilisation treatments (mg/kg).
Table 3. Cotton growth and yield under different fertilisation treatments.
Figure 2. Phosphorus concentration (a) and absorption (b) of cotton under different fertilisation treatments.
Note: n = 4. Vertical bars represent the average standard deviation of the means. The different colors of the column represent the nutrient uptake of different organs (stem, leaf, capsule wall, seed, and fibre, from bottom to top). Different letters indicate significant difference among treatments based on Tukey test for Duncan (p < 0.05). OF, organic matter fertiliser treatment; CT, acid compost tea treatment; HP, phosphoric acid (pH = 1) treatment; CK, no fertiliser treatment.
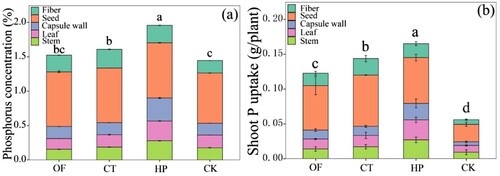
Table 4. P balance, PUE (%), AEP (kg/kg), PFR (%), and PAR (%) values under different treatments.
Figure 3. Results of redundancy analysis for P fractions and soil physicochemical properties in different fertilisation treatments.
Note: n = 16. pH, soil pH; OM: organic matter content; TN, soil total nitrogen; TP, soil total phosphorus; APT, soil alkaline phosphatase activity. OF, organic matter fertiliser treatment; CT, acid compost tea treatment; HP, phosphoric acid (pH = 1) treatment; CK, no fertiliser treatment. Water-P, water-soluble phosphorus; NaHCO3-Pi, inorganic phosphorus extracted from NaHCO3; NaHCO3-Po, organic phosphorus extracted from NaHCO3; NaOH-Pi, inorganic phosphorus extracted from NaOH; NaOH-Po, organic phosphorus extracted from NaOH; HCl-P, phosphorus extracted from HCl; Residue-P, phosphorus digested from the residue.
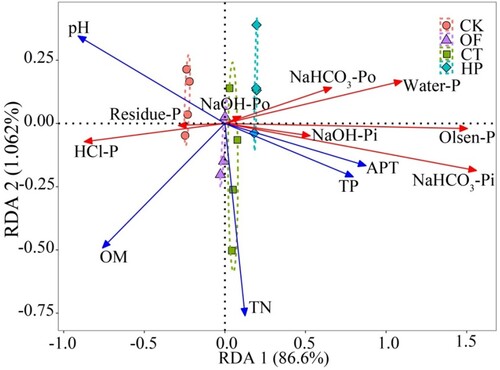
Figure 4. Soil pH (a), alkaline phosphatase activity (b), and organic matter (c) under different fertilisation treatments.
Note: n = 4. Vertical bars represent the average standard deviation of the means. Values followed by different letters indicate significant difference among treatments (p <0.05). OF, organic matter fertiliser treatment; CT, acid compost tea treatment; HP, phosphoric acid (pH = 1) treatment; CK, no fertiliser treatment.
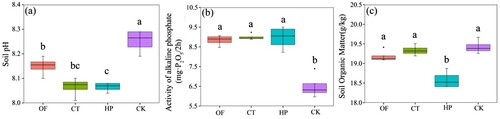
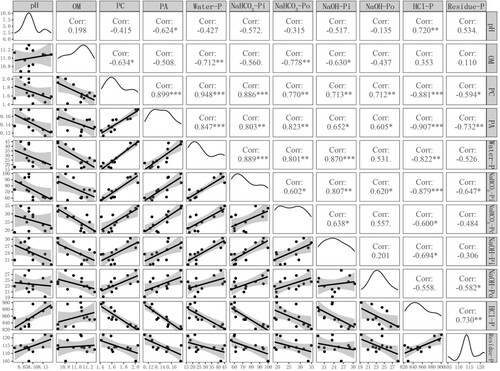
Figure 5. Pearson correlation coefficients (r values) between different phosphate fractions and soil properties and phosphorus uptake by cotton in fertilisation treatments.
Note: n = 12 (OF, CT, and HP);*, p < 0.05; **, p < 0.01; ***, p < 0.005. pH, soil pH; OM, soil organic matter; PC, P concentration in Plants; PA, P accumulation in plants. OF, organic matter fertiliser treatment; CT, acid compost tea treatment; HP, phosphoric acid (pH = 1) treatment; CK, no fertiliser treatment. Water-P, water-soluble phosphorus; NaHCO3-Pi, inorganic phosphorus extracted from NaHCO3; NaHCO3-Po, organic phosphorus extracted from NaHCO3; NaOH-Pi, inorganic phosphorus extracted from NaOH; NaOH-Po, organic phosphorus extracted from NaOH; HCl-P, phosphorus extracted from HCl; Residue-P, phosphorus digested from the residue.