
Figures & data
Figure 1. Monthly averages of air temperature (2 m above ground) and monthly accumulated precipitation during the field experiment, recorded on the nearby weather station Sunndalsøra III. Light grey columns show the precipitation during the growing season, from April to September.
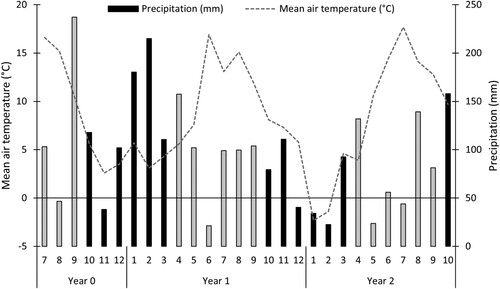
Table 1. Dates and management operations performed in the field.
Table 2. Characteristics of the organic materials applied in the field experiment, n = 1. DM = dry matter.
Table 3. Cover crop % of coverage, total dry weight (CC + weeds) and estimated cover crop dry weight, total NPK uptake in treatments receiving a single application of various organic materials in year 0. Within each year and characteristics, different letters indicate statistically significant differences between treatments, Tukey test (p < 0.05).
Table 4. Mean values (year 2) for soil pH, AL-extractable nutrients (mg/ 100 g air-dry soil) and SOC stocks (Mg ha−1). For each characteristic, different letters (a, b) indicate statistically significant differences between organic amendments and the Control, or between treatments with and without cover crop (CC). Tukey test (P < 0.05).
Figure 2. Mean values (year 2) of soil organic matter concentrations in treatments that received a single application of organic materials in year 0, and in plots with and without cover crops. Different letters indicate statistically significant differences (n = 6) between organic amendments, or for the effect of cover crop (CC). Loss on soil organic matter (%) in the treatments in year 2 compared to year 0.
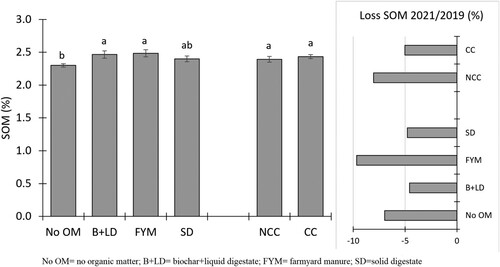
Table 5. Mean values and p-values of nutrient concentrations in the potato petioles in treatments that received a single application of organic amendments in year 0, with winter cover crop (CC) and without winter cover crop (NCC).
Figure 3. Tuber yield (Mg ha−1, dark grey columns) and marketable yields (Mg ha−1, in light grey) for the treatments with the addition of different organic materials (OM) and the control (No OM) and across treatments with (CC) or without cover crop (NCC) in year 1 (a), year 2 (b), and after 4 months of storage in year 2 (c). Inserted tables are the p-values for the effect of OM and CC and their interactions (CC × OM) on tuber and marketable yields.
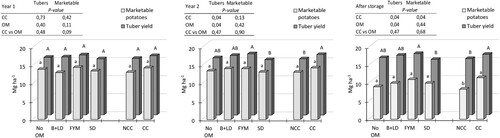
Figure 4. Sorted out tubers (%) in treatments with the addition of different organic materials (OM) and the control (No OM), and across treatments with (CC) and without cover crop (NCC) by harvest in year 1, year 2, and after 4 months of storage in year 2.
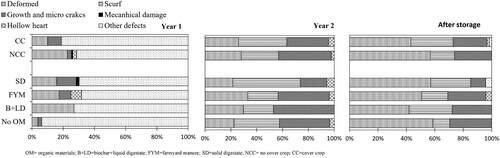
Figure 5. Daily CO2 fluxes as g CO2-C m−2 d−1 and accumulated emissions as g CO2-C m−2 from sandy soil with organic amendments and effect of freeze–thaw events (FT). Mean values of 4 replicates per treatment.
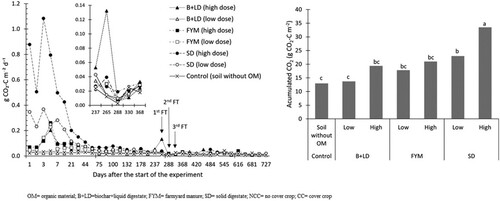
Table 6. Microbial carbon (MBC), fungi to bacteria ratio (F:B), decomposition rate (−k), and mean resident time (MRT in years) of the sandy soil amened different types and rates of organic materials incubated for 727 days.