Figures & data
Figure 1. The location of the study area and the research sites from reported literature. (a) the sites location, XA: Xi’an, Chinese Loess Plateau, this study; AUS: Australia (Yao et al. Citation2019); GER: Germany (Spohn and Giani Citation2011); SC: South China, Hunan (Wang et al. Citation2007) and Guangxi (Wang and Wang Citation2007); SRB: Republic of Serbia (Šeremešić et al. Citation2013); USA: United States (Rodriguez et al. Citation2021). The map of mean annual precipitation (MAP) is from the data in https://psl.noaa.gov/. (b), the location of study site and Chinese Loess Plateau. (c), the mean annual temperature and annual precipitation of Xi’an, data are cited from http://data.cma.cn.
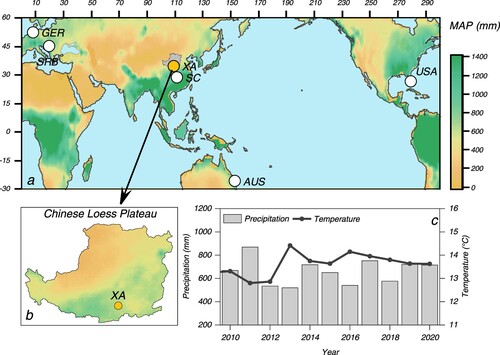
Figure 2. The carbon content of the topsoil of the study area. (a) soil organic carbon (SOC) content at 0-5 cm and 5-10 cm, (b) hot water extractable organic carbon (HWOC) content at 0-5 cm and 5-10 cm. The box shows the mean value and ±1σ standard deviation range, and the whisker shows the outlier data.
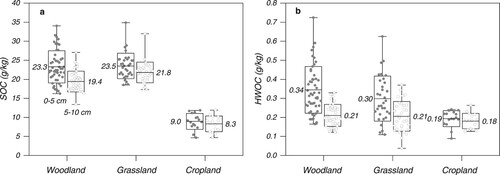
Table 1. The primary extraction conditions of hot water extractable organic carbon (HWOC).
Figure 3. Comparison of soil organic carbon (SOC) and hot water extractable organic carbon (HWOC) contents between the study area and literature reports. (a) SOC content of woodland, (b) SOC content of grassland, (c) SOC content of arable land, (d) HWOC content of woodland, (e) HWOC content of grassland, and (f) HWOC content of arable land. P/T is the ratio of annual precipitation to annual average temperature, which represents the corresponding precipitation per degree centigrade. AUS: Australia; GER: Germany; SC: South China, Hunan and Guangxi; SRB: Republic of Serbia; USA: United States; XA: Xi’an, Chinese Loess Plateau. Error bars show 1σ standard deviation. XA, AUS, HN and USA were 0-10 cm, and GX, SRB and GER were 0-20 cm.
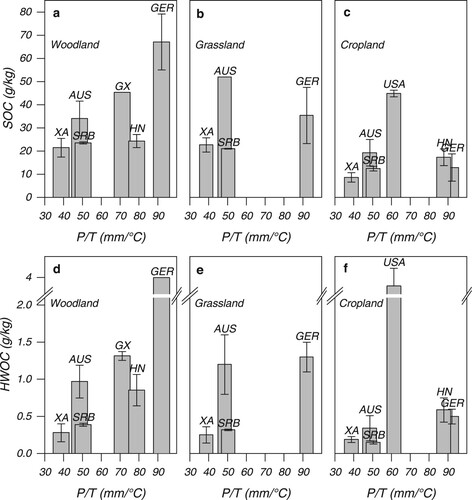
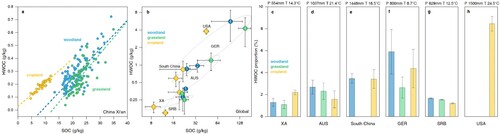
Figure 4. Hot water extractable organic carbon (HWOC) content and HWOC proportion. (a) HWOC and soil organic carbon (SOC) contents of the study area in 0-10 cm, (b) HWOC and SOC contents from the literature reports, (c) HWOC proportion of the study area, (d), (e), (f), (g) and (h) HWOC proportion from the literature reports. AUS: Australia; GER: Germany; SC: South China, Hunan and Guangxi; SRB: Republic of Serbia; USA: United States; XA: Xi’an, Chinese Loess Plateau. Error bars show 1σ standard deviation.