
Figures & data
Table 1. Fertilisation: levels and quantities (NPK kg ha−1 and FYM* Mg ha−1) in the long-term NPK fertilisation trial in 1975–2021 in Kuusiku.
Figure 1. Characterisation of the weather: T – air temperature, °C, mm – precipitation, mm, during the trial period 1976–2021 in Kuusiku.
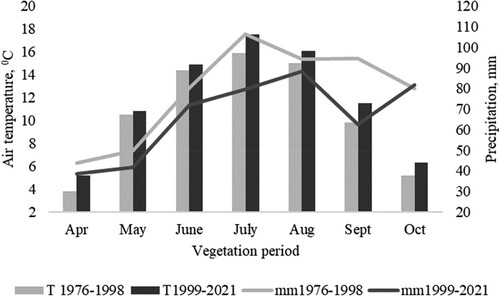
Figure 2. Effect of long-term fertilisation (NPK kg ha−1 and manure (FYM) Mg ha−1) on soil organic carbon concentration, SOC%, in the NPK fertilisation experiment of the crop rotation; LSD95% – level of 95% confidence in the LSD0.05 (LSD; least significant difference) test MS Excel.
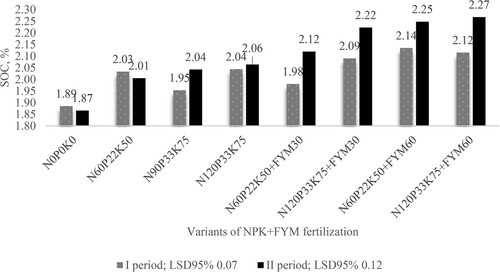
Table 2. Overview of crop yield changes in the long-term fertilisation experiment of the crop rotation in the years 1976–1995 and 1996–2021 on Calcisol loamy soil in Kuusiku.
Table 3. The effect of fertilisation (NPK kg ha−1 and manure (FYM) Mg ha−1) on the content of stable and labile forms of organic carbon in sandy loam Calcisols in the 0–0.20 and 0.20–0.40 m soil layer in Kuusiku.