
Figures & data
Figure 1. Scanning electron microscopy showing the perineal pattern of M. incognita. The high squared dorsal arch, wavy striae are key features of M. incognita.
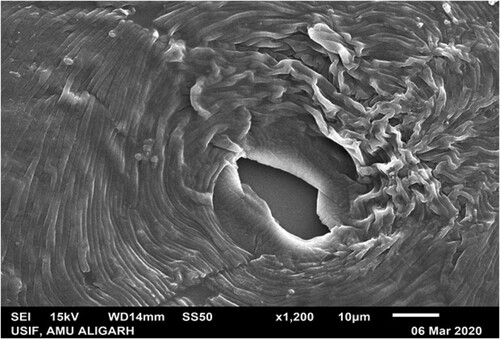
Figure 2. GC–MS chromatograms of methanolic leaf extract of I. carnea. Values given in parentheses represent the retention time of each compound; Values given without parentheses represent the peak number of each compound.
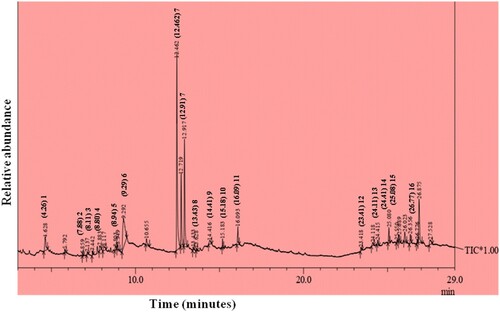
Table 1. Catalog of identified compounds present in methanolic leaf extract of I. carnea determined by GC–MS analysis.
Figure 3. Effect of several concentrations of the leaf extract of I. carnea on J2s hatching of M. incognita over 4 days of incubation period under in vitro. Each value is an average of six replicates. Each bar followed by the same letter is not significantly different according to Duncan’s multiple-range test (p ≤ 0.05). [DW – distilled water; (Control); J2s – second stage juveniles; ppm – parts per million].
![Figure 3. Effect of several concentrations of the leaf extract of I. carnea on J2s hatching of M. incognita over 4 days of incubation period under in vitro. Each value is an average of six replicates. Each bar followed by the same letter is not significantly different according to Duncan’s multiple-range test (p ≤ 0.05). [DW – distilled water; (Control); J2s – second stage juveniles; ppm – parts per million].](/cms/asset/12121dbb-df3d-4fd3-a11c-142b72941187/sagb_a_2194305_f0003_oc.jpg)
Table 2. Effect of various concentrations of the leaf extract of I. carnea on mortality of J2s of M. incognita over 12, 24, 48 and 72 h of exposure period under in vitro.
Table 3. Nematicidal activity of leaf extract of I. carnea against J2s of M. incognita.
Figure 4. Nematicidal effect of different concentrations of (250, 500, 750 and 1000 ppm) of leaf extract of I. carnea on the growth attributes of J2s inoculated carrot plants under pot condition. Each bar followed by same letter is not significantly different according to Duncan’s multiple-range test (p ≤ 0.05). (J2s only – second stage juveniles only; ppm – parts per million).
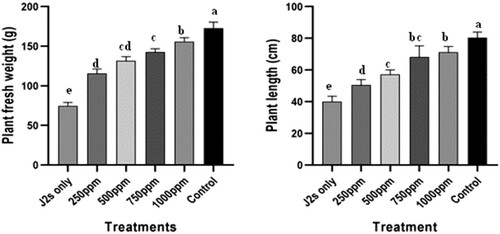
Figure 5. Nematicidal effect of different concentrations of (250, 500, 750 and 1000 ppm) of leaf extract of I. carnea on the physiological attributes of J2s inoculated carrot plants under pot condition. Each bar followed by the same letter is not significantly different according to Duncan’s multiple-range test (p ≤ 0.05). (J2s only – second stage juveniles only; ppm – parts per million).
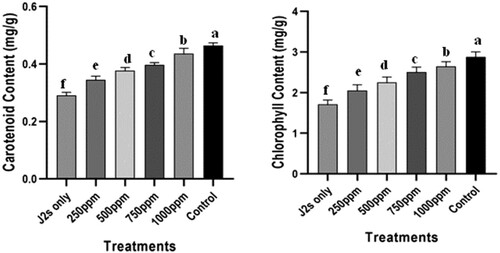
Figure 6. Nematicidal effect of different concentrations (250, 500, 750 and 1000 ppm) of leaf extract of I. carnea on the pathological attributes of J2s inoculated carrot plants under pot condition. Each bar followed by the same letter is not significantly different according to Duncan’s multiple-range test (p ≤ 0.05). (J2s only – second stage juveniles only; ppm – parts per million).
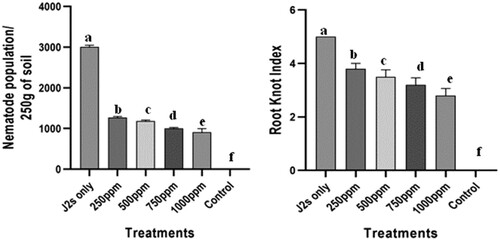
Figure 7. The biplots of principal component analysis, comparing the effects of different concentrations (250, 500, 750 and 1000 ppm) of leaf extract of I. carnea on various studied parameters of J2s inoculated carrot plants (PFW = plant fresh weight; PL = plant length; CHL = chlorophyll content; CRT = carotenoid content; NP/200 g = nematode population /200 g soil; RKI = root-knot index).
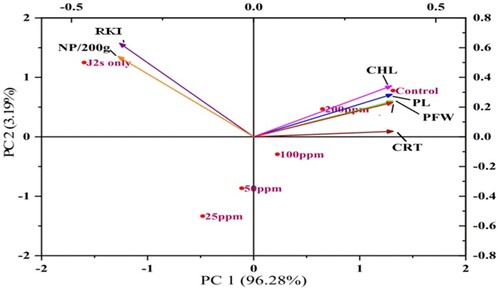
Figure 8. Representation of (a) docked 2-amino-2-methyl-1-propanol into ODR-1 at active sites, (inset) representation of an enlarged view of involved molecular interactions and (b) 2-D representation of involved molecular interactions.
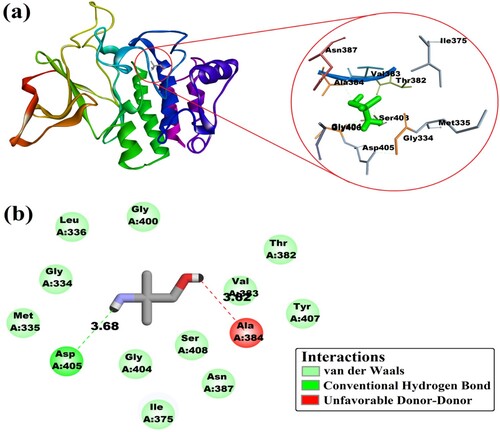
Figure 9. Representation of (a) docked neophytadiene into ODR-1 at active sites, (inset) representation of an enlarged view of involved molecular interactions and (b) 2-D representation of involved molecular interactions.
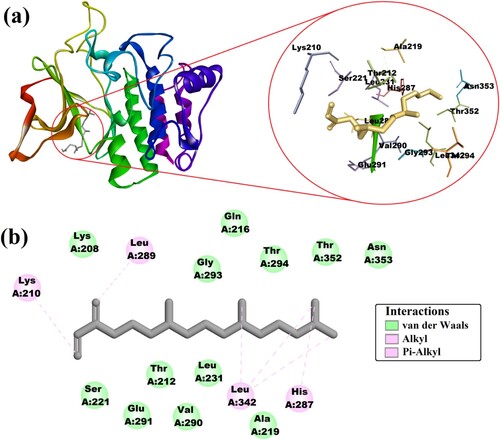
Table 4. The receptor–ligand interactions result by Discovery.
Data availability statement
All the data is present in this manuscript.