
Figures & data
Figure 1. Conceptual framework of the study modified from Vishnudas, (2006) and Mawhorter, (2010) and from experience.
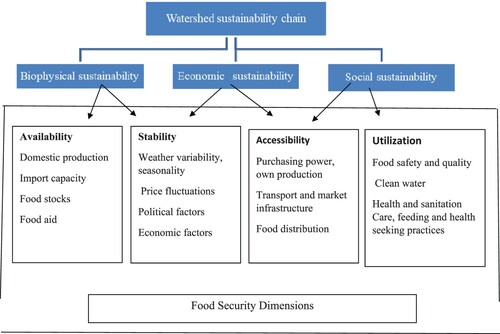
Figure 2. Map of the Study Area.
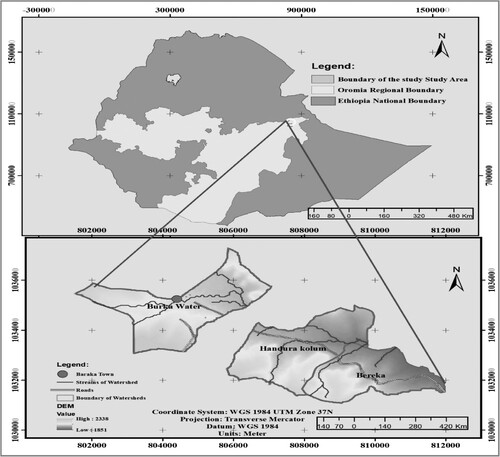
Table 1. List of micro watershed management systems covered by the study.
Figure 3. Mean annual temperature and rainfall of Qarsa woreda (2000–2020).
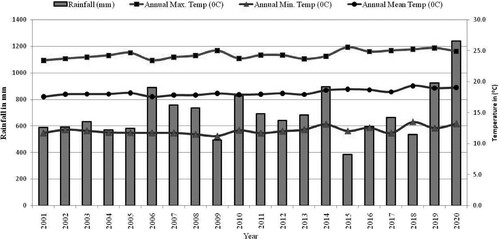
Table 2. Description of Landsat image.
Table 3. Description of land use and land cover categories considered in image classification.
Figure 4. Land use the land cover of Burqa Water (2009–2020).
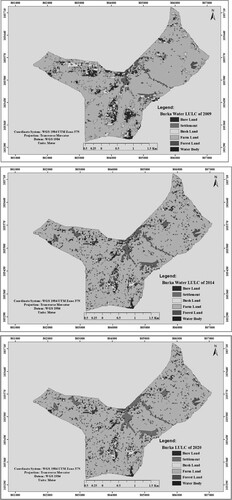
Figure 5. Land use land cover of Barka (2009–2020).
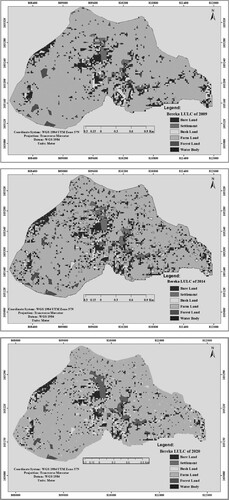
Figure 6. Land use land cover of Adhura Kusum (2009–2020).
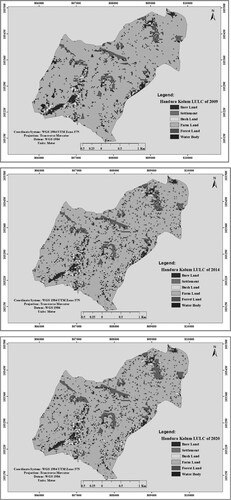
Table 4. Matrix for land use and land cover changes for 2009–2014 in Hectares (ha).
Table 5. Matrix for land use and land cover changes for 2015–2020 in Hectares (ha).
Table 6. Household response on effectiveness of watershed implementation on Biophysical land rehabilitation
Table 7. Household responses to the effectiveness of Watershed Management Practices for socioeconomic improvement.
Table 8. Household Repose on effectiveness of Watershed Management on access to water and livestock feed.
Table 9. The number of months of food shortage before and after implementing integrated watershed management.
Data availability statement
Data will be made available on request.