
Figures & data
Figure 1. Farm sizes and age distribution of the respondents.
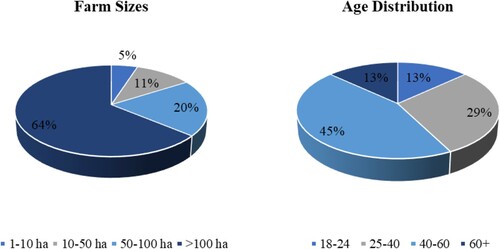
Figure 2. Age distribution in the farms and the most common size of farms.
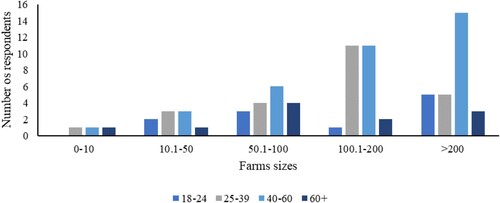
Figure 3. The main types of organic fertilisers used by farmers in the survey.
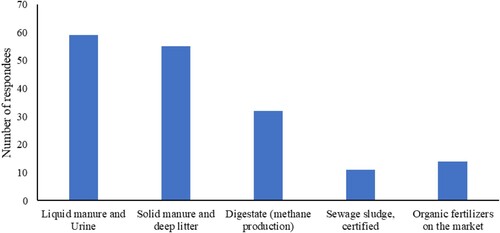
Figure 4. Amount of applied N presented for intervals of N amounts applied (kg per hectare). The line shows the distribution among respondees (%) for applications of total amounts of N (organic and mineral). The stacked bars show how much of N applied (kg per hectare) came from organic fertilisers, presented as distribution among respondees within each interval on x-axis.
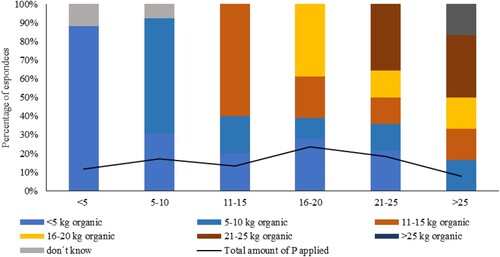
Figure 5. Amount of applied P presented for intervals of P amounts applied (kg per hectare). The line shows the distribution among respondees (%) for applications of total amounts of P (organic and mineral). The stacked bars show how much of P applied (kg per hectare) came from organic fertilisers, presented as distribution among respondees within each interval on x-axis.
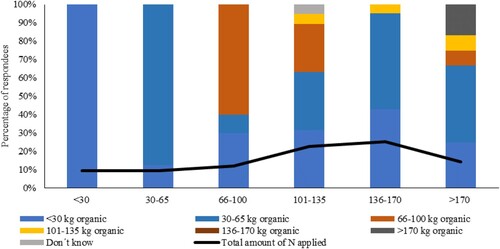
Table 1. Current vs. anticipated future use of organic fertilisers according to the farmers’ perceptions in the perspective of the coming five years (number of answers).
Figure 6. Reasons and level of importance for using organic fertilisers, according to the respondents.
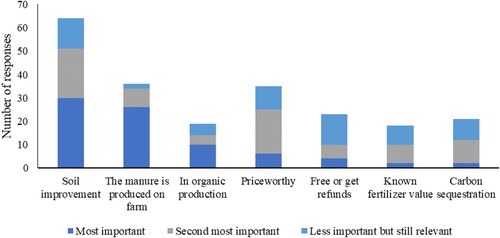
Figure 7. Reasons and level of importance for not using organic fertilisers, according to the respondents.
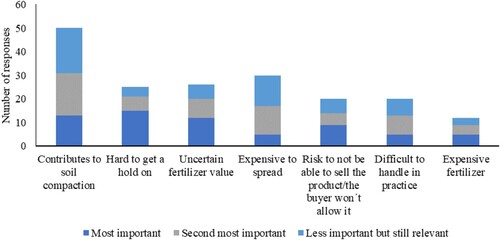
Figure 8. Preference between slow and fast release of nutrients, according to the respondents (percentage of answers) divided into answers from farmers practicing organic and conventional farming, respectively.
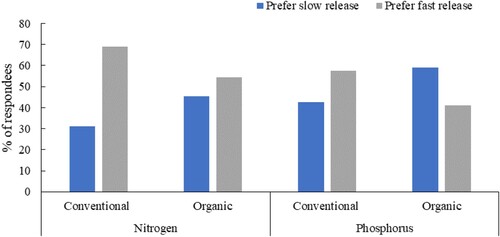
Table 2. Importance of carbon content in organic fertilisers, according to the respondents in % of total and distributed on conventional and organic farms.
Figure 9. Preferences on forms of organic fertiliser, according to the respondents.
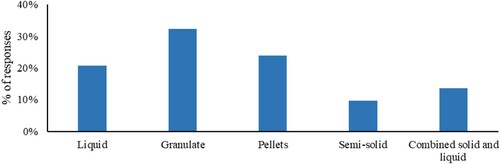
Figure 10. Alternatives that the respondents considered interesting for using as fertiliser.
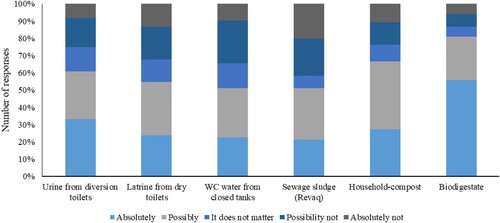
Figure 11. Distribution of positive versus negative inclination towards alternative organic fertilisers according to the age groups of the respondents.
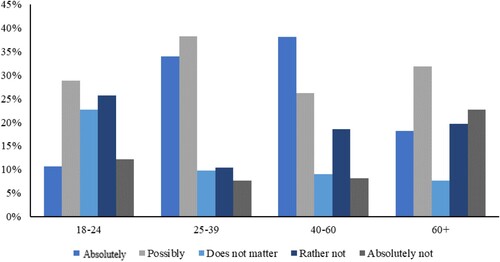
Table A1. Questionnaire applied to the farmers.