
Figures & data
Table 1. Soil properties under the reclamation of abandoned salinised farmlands by planting different crops.
Figure 1. Relative abundance of dominant bacterial (a) and fungal phyla (b) (relative abundance >5%) under the reclamation of abandoned salinised farmlands by planting different crops. Cot, Cotton cropping; Alf, alfalfa cropping; Rap, rapeseed cropping. The same below.
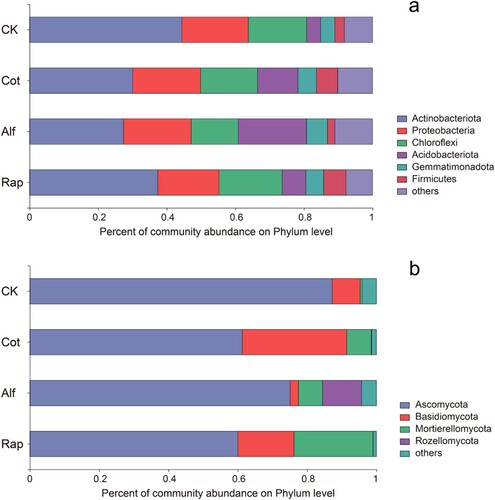
Figure 2. Hierarchical clustering analysis (a, bacteria; b, fungi) and PCA analysis (c, bacteria; d, fungi) of bacterial phyla and fungal phyla at the OTU level.
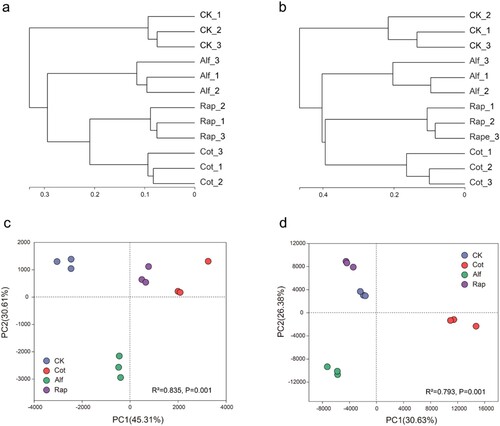
Figure 3. Venn diagram of unique and common OTUs.
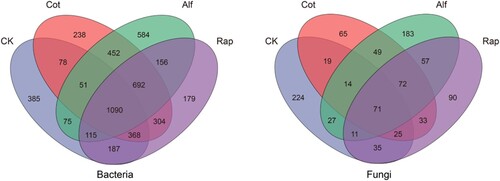
Figure 4. α-diversity of soil bacterial (a, b) and fungal communities (c, d) during the reclamation of abandoned salinised farmlands by planting different crops. *, p < 0.05; **, p < 0.01; ***, p < 0.001.
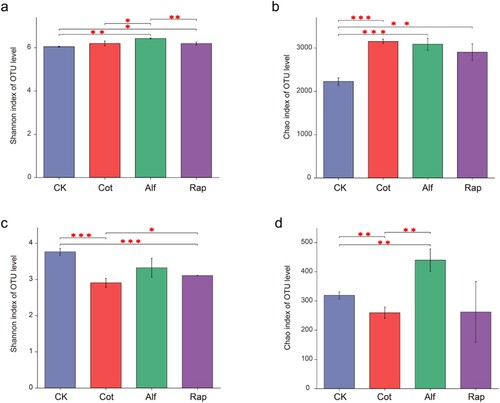
Figure 5. Redundancy analysis (RDA) between bacterial community and soil properties (a) as well as canonical correspondence analysis (CCA) between fungal community and soil properties (b). EC, electrical conductivity; TK, total potassium; TP, total phosphorus; C/N ratio, total carbon/total nitrogen ratio.
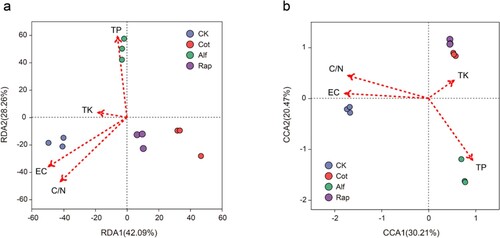
Figure 6. Correlation between soil factors and bacterial (a)/fungal (b) community at the phyla level. TC, total carbon; TN, total nitrogen. *, p < 0.05; **, p < 0.01; ***, p < 0.001.
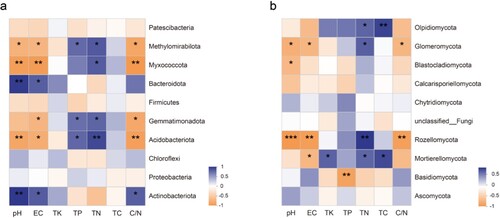
Table 2. Correlation between soil factors and RDA axes.
Table 3. Correlation between soil factors and CCA axes.
Table 4. PERMANOVA analysis of the effects of soil factors on soil bacterial and fungal community.