360
Views
6
CrossRef citations to date
0
Altmetric
ORIGINAL ARTICLES

Simulating the effects of mapping and spraying resolution and threshold level on accuracy of patch spraying decisions and herbicide use based on mapped weed data

, , &
Pages 216-229 | Received 13 Nov 2006, Published online: 20 Aug 2008

Figures & data

Figure 1.  Experimental design with an example of spraying decisions in ‘ground truth’: open (□) and filled squares (▪) are quadrats (0.25 m2) with weed densities below and above the threshold, respectively. Rectangles (- - -) delimit sprayed patches by a 14.5 m wide boom travelling in direction 1 and images taken every 1.5 m (3 m) along the line indicated by the arrow on the left. Further details in text (Material and methods).
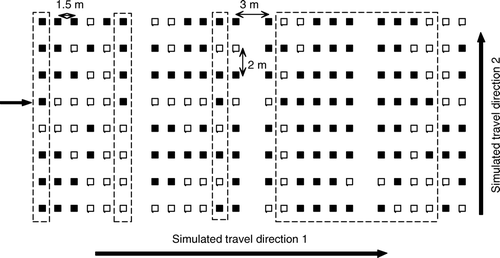
Figure 1.  Experimental design with an example of spraying decisions in ‘ground truth’: open (□) and filled squares (▪) are quadrats (0.25 m2) with weed densities below and above the threshold, respectively. Rectangles (- - -) delimit sprayed patches by a 14.5 m wide boom travelling in direction 1 and images taken every 1.5 m (3 m) along the line indicated by the arrow on the left. Further details in text (Material and methods).

Table I. Definition and weed threshold densities (plants m−2) of threshold model, after Fykse (1991). Decision is ‘spray’ if criterion xx is met.

Table II. Summary statistics of total weed density per trial and as mean of all trials (last column).

Table III. Mean total weed density and mean density (weeds m−2) of the five criteria species in the threshold model (cf. ), per trial and as mean of all trials (last column). Rows denoted by letters (a,b,c) are proportions of quadrats (%) above the actual criterion in ‘ground truth’ when threshold values were either reduced by 25% (a), original (b) or increased by 25% (c). Empty cells = species not present.

Figure 2.  Mean total error (TOE) with 95% confidence interval bars of mean versus boom width and image distance, original threshold level. Black bold lines: connected means of equal boom width.
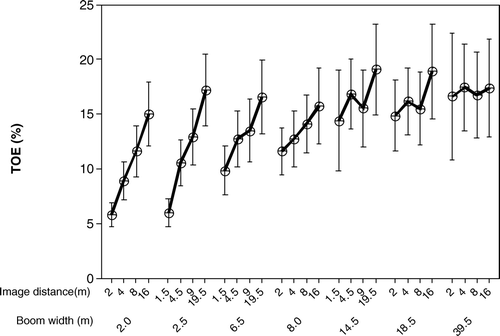
Figure 2.  Mean total error (TOE) with 95% confidence interval bars of mean versus boom width and image distance, original threshold level. Black bold lines: connected means of equal boom width.

Figure 3.  Total error (TOE) per trial at three threshold levels and two spraying resolutions: (A) boom width 2 m and image distance 2 m, and (B) boom width 14.5 m and image distance 4.5 m, versus proportion of quadrats with weed infestation below the threshold (WBT) per trial at the original threshold level. Figures above bars are trial numbers.
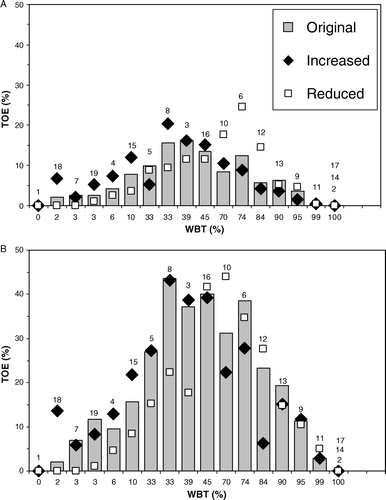
Figure 3.  Total error (TOE) per trial at three threshold levels and two spraying resolutions: (A) boom width 2 m and image distance 2 m, and (B) boom width 14.5 m and image distance 4.5 m, versus proportion of quadrats with weed infestation below the threshold (WBT) per trial at the original threshold level. Figures above bars are trial numbers.

Figure 4.  Predicted total error (TOE) as a function of boom width and image distance from non-linear regression model (see equation Equation6) with parameter coefficients for original threshold ().
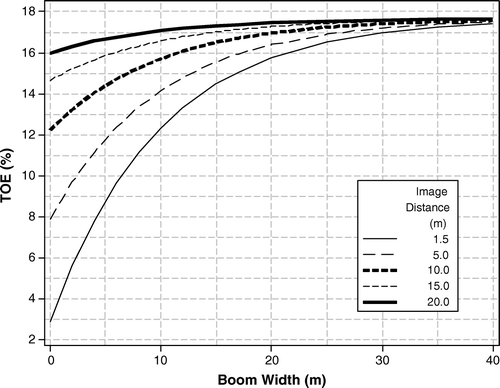
Figure 4.  Predicted total error (TOE) as a function of boom width and image distance from non-linear regression model (see equation Equation6) with parameter coefficients for original threshold (Table IV).

Table IV. Regression model parameter estimates for prediction of mean mapping error (MAE), spraying error (SPE) and total error (TOE) from boom width and image distance. SE = standard error, R 2=coefficient of determination, MSE = mean square error. See equation Equation6 for model.

Figure 5.  Mean simulated herbicide reduction (SHR) versus potential herbicide reduction (PHR) per trial at two selected spraying resolutions: • = boom width 2.0 m and image distance 2.0 m, ○ = boom width 39.5 m and image distance 16.0 m. Original threshold level. Data point labels are trial ID numbers.
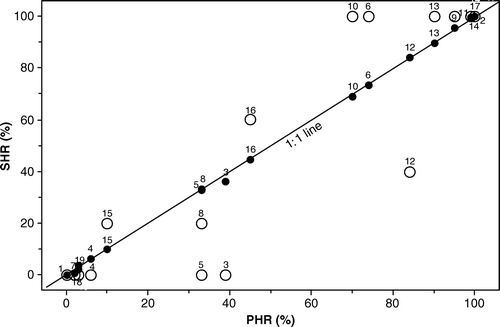
Figure 5.  Mean simulated herbicide reduction (SHR) versus potential herbicide reduction (PHR) per trial at two selected spraying resolutions: • = boom width 2.0 m and image distance 2.0 m, ○ = boom width 39.5 m and image distance 16.0 m. Original threshold level. Data point labels are trial ID numbers.

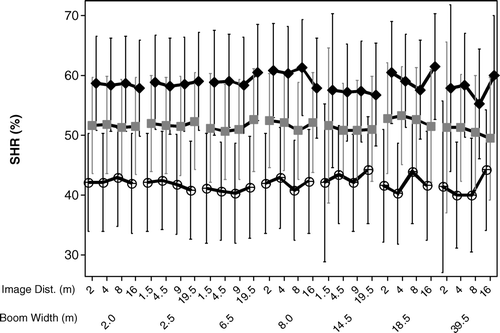
Figure 6.  Mean simulated herbicide reductions (SHR) with 95% confidence interval bars of mean versus spraying resolution (boom width and image distance), for original threshold level (

, mean SHR 52%), increased threshold level (♦, mean SHR 59%) and reduced threshold level (⊕, mean SHR 42%). Black bold lines: connected means of equal boom width.

Figure 6.  Mean simulated herbicide reductions (SHR) with 95% confidence interval bars of mean versus spraying resolution (boom width and image distance), for original threshold level (Display full size, mean SHR 52%), increased threshold level (♦, mean SHR 59%) and reduced threshold level (⊕, mean SHR 42%). Black bold lines: connected means of equal boom width.

Figure 7.  Illustration of the influence of threshold level on simulated herbicide reduction (SHR) per trial at two selected spraying resolutions: ○ = boom width 14.5 m and image distance 4.5 m. • = boom width 2 m and image distance 2 m. ‘SHR range’ is the absolute difference in SHR between the two threshold levels giving the lowest and highest SHR in the actual trial. Each trial is plotted according to its proportion of quadrats with weed infestation below the original threshold level (WBT).
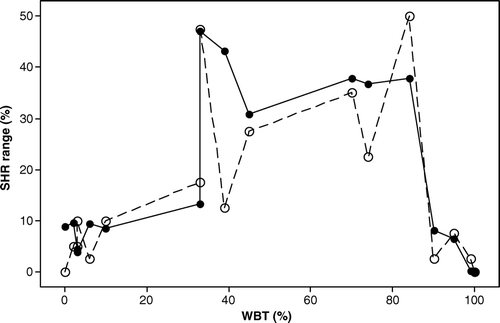
Figure 7.  Illustration of the influence of threshold level on simulated herbicide reduction (SHR) per trial at two selected spraying resolutions: ○ = boom width 14.5 m and image distance 4.5 m. • = boom width 2 m and image distance 2 m. ‘SHR range’ is the absolute difference in SHR between the two threshold levels giving the lowest and highest SHR in the actual trial. Each trial is plotted according to its proportion of quadrats with weed infestation below the original threshold level (WBT).

Reprints and Corporate Permissions

Please note: Selecting permissions does not provide access to the full text of the article, please see our help page How do I view content?

To request a reprint or corporate permissions for this article, please click on the relevant link below:

Academic Permissions

Please note: Selecting permissions does not provide access to the full text of the article, please see our help page How do I view content?

Obtain permissions instantly via Rightslink by clicking on the button below:

If you are unable to obtain permissions via Rightslink, please complete and submit this Permissions form. For more information, please visit our Permissions help page.