Figures & data
Figure 1. X-ray diffraction patterns of sepiolite (A) and lime (B). •: Sepiolite; □: Quartz;▴:Calcium Hydroxide; ○: Calcite.
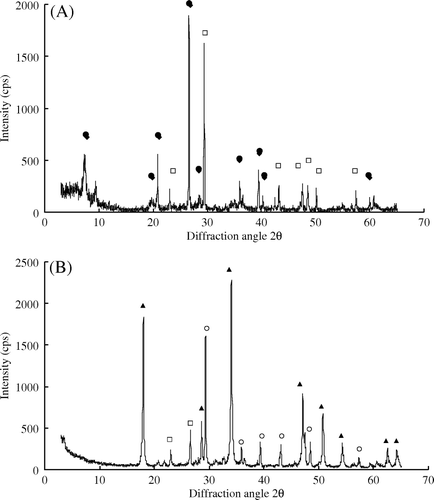
Figure 2. Relationships between soil pH and Cd concentrations in soil extracted by 0.1M NaNO3 (A), 0.01 M CaCl2 (B) and DTPA (C). (◊) CK: Control (unamended); (▴) L: Lime applied at 150 g m−2; (▪) S: Sepiolite applied at 2250 g m−2; (•) LS: Lime applied (at 150 g m−2) in a mixture with sepiolite (at 2250 g m−2). ***Significant at p <0.001; *Significant at p <0.05.
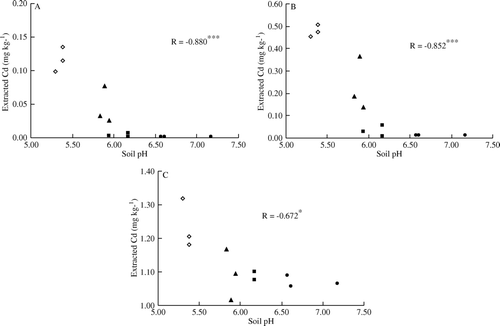
Table I. Mean values of pH, CEC, CaCO3, DCB-Fe and single-extractable Cd in plough-layer soils treated by different amendments (n=3 for each treatment).
Figure 3. Distribution of cadmium (%) in soil affected by different amendments (□) EX: Water-soluble plus exchangeable Cd; (![]()
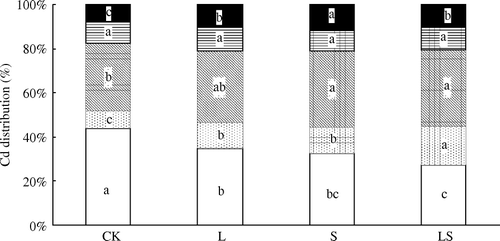
Figure 4. Biomass productions obtained for different treatments (kg ha−1, Dry weight) (□) CK; (□) L;(□) S;(▪) LS. Means and standard errors followed by the same letter are not significantly different (LSD, p>0.05).
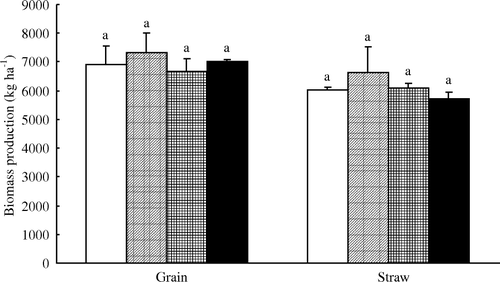
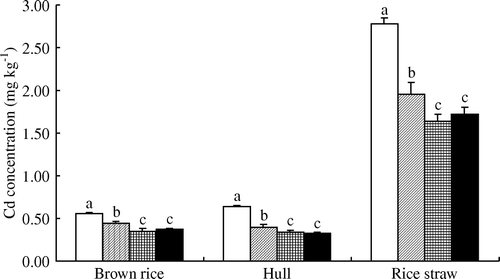
Figure 5. Cadmium contents (mg kg−1, Dry weight) in brown rice, hull and straw (□) CK; (□) L; (□) S; (▪) LS. Means and standard errors followed by the same letter are not significantly different (LSD, p>0.05).