Figures & data
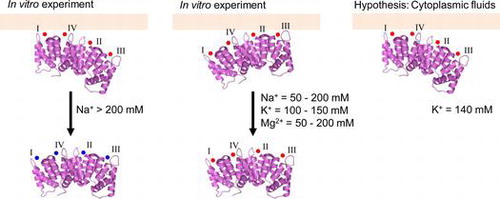
Fig. 1. Schematic representation of Anx4.
Notes: Image produced with PyMOLCitation33) using the PDB data (PDB entry 2ZHJ) for annexin IV.Citation20) Arrows represent the positions of CBS I, II, III, and IV, respectively; N and C indicate the N- and C-termini. Spheres represent the mutated residue on each CBS.
Table 1. Primers for the substitution of the residue on CBSs of annexin IV.
Table 2. Summarized variant species of annexin IV.
Fig. 2. Calcium-dependent membrane association of Anx4.
Notes: Membrane association by wild-type Anx4 was investigated in various concentrations of calcium in the absence (open circles) and presence (closed circles) of 150 mM sodium chloride. Data represent the average ± standard deviation of three independent experiments.
Fig. 3. Metal-dependent dissociation of Anx4.
Notes: Anx4 dissociation was investigated at various concentrations of sodium chloride (closed circles and solid line), magnesium chloride (open triangles and dashed line), and potassium chloride (open squares and dotted line). Data represent the average ± standard deviation of three independent experiments.
Fig. 4. Calcium-dependent association and sodium-dependent dissociation of variants with a quadruple substitution.
Notes: (A) Membrane association of variants with a quadruple substitution, CBS-AAAA was investigated in various concentrations of calcium. (B) Dissociation of CBS-AAAA was investigated in various concentrations of sodium chloride. The ratio was expressed as the percentage of bound CBS-AAAA to bound wild-type Anx4 in the presence of 200 μM calcium chloride. Data represent the average ± standard deviation of three independent experiments. The proportion of membrane-bound variants was calculated by dividing the band intensity of the membrane-bound protein by that of the membrane-bound wild-type protein in the presence of 2 mM calcium chloride.
Fig. 5. Calcium-dependent association and sodium-dependent dissociation of variants with a triplet substitution.
Notes: (A) Membrane association of variants with a triplet substitution in various concentrations of calcium: CBS-1AAA (closed circles and solid line), CBS-A2AA (open circles and short dashed line), CBS-AA3A (closed triangles and long dashed line), and CBS-AAA4 (open triangles and dotted dashed line). (B) Membrane dissociation of CBS-1AAA (closed circles and solid line), CBS-A2AA (open circles and short dashed line), CBS-AA3A (closed triangles and long dashed line), and CBS-AAA4 (open triangles and dotted line) was investigated in various concentrations of sodium. Data represent the average ± standard deviation of three independent experiments.
Fig. 6. Calcium-dependent association and sodium-dependent dissociation of variants with a single substitution.
Notes: Calcium-dependent association (A) and sodium-dependent dissociation (B) of variants with a single substitution: CBS-A234 (closed circles and solid line), CBS-1A34 (open circles and short dashed line), CBS-12A4 (closed triangles and dotted line), and CBS-123A (open triangles and long dashed line). Data represent the average ± standard deviation of three independent experiments.
Fig. 7. Calcium-dependent association and sodium-dependent dissociation of variants with a double substitution.
Notes: Calcium-dependent association (A, B, and C) and sodium-dependent dissociation (D, E, and F) were investigated. In panels A and D, CBS-12AA and CBS-AA34 are represented by open circles and a dashed line and by closed circles and a solid line, respectively. In panels B and E, CBS-1A3A and CBS-A2A4 are represented by open squares and a dashed line and by closed squares and a solid line, respectively. In panels C and F, CBS-1AA4 and CBS-A23A are represented by open triangles and a dashed line and by closed triangles and a solid line, respectively. Data represent the average ± standard deviation of three independent experiments.
Fig. 8. Schematic model of the association and dissociation of Anx4.
Notes: Schematic models for loss of the stronger interaction (A), loss of the weaker interaction (B), and the manner of the association in cytoplasmic fluid (C). In each model, Anx4 is drawn as shown in Fig. . Symbols I, II, III, and IV represent CBS I, II, III, and IV, respectively. Light gray bars show the lipid membrane. Small black and gray circles represent calcium and sodium ions, respectively.