1,109
Views
13
CrossRef citations to date
0
Altmetric
Food & Nutrition Science

Insulin injection restored increased insulin receptor substrate (IRS)-2 protein during short-term protein restriction but did not affect reduced insulin-like growth factor (IGF)-I mRNA or increased triglyceride accumulation in the liver of rats

, , , , , & show all
Pages 130-138 | Received 13 Aug 2013, Accepted 09 Oct 2013, Published online: 30 Apr 2014

Figures & data

Table 1. Composition of experimental diet.

Fig. 1. AUC for 0–4.5 h plasma human insulin (A), total insulin (B), and glucose levels (C).

Note: Rats were fed a low protein diet (5C) or a control diet (15C) for 8 h/d with injection of intermediate-acting human insulin before and 3 h after the onset of feeding. On days 1 and 7, heparinized blood was collected from the tail at 0, 1.5, 3, and 4.5 h after the onset of feeding, and plasma insulin and glucose concentrations were measured. Means ± standard errors are represented (n = 4 or 5). Results of Student’s t test (A and B) or two-way ANOVA (C) are given below the graph (*p < 0.05, **p < 0.01, ***p < 0.001).
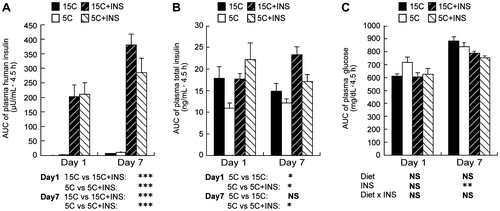
Fig. 1. AUC for 0–4.5 h plasma human insulin (A), total insulin (B), and glucose levels (C).Note: Rats were fed a low protein diet (5C) or a control diet (15C) for 8 h/d with injection of intermediate-acting human insulin before and 3 h after the onset of feeding. On days 1 and 7, heparinized blood was collected from the tail at 0, 1.5, 3, and 4.5 h after the onset of feeding, and plasma insulin and glucose concentrations were measured. Means ± standard errors are represented (n = 4 or 5). Results of Student’s t test (A and B) or two-way ANOVA (C) are given below the graph (*p < 0.05, **p < 0.01, ***p < 0.001).

Table 2. Characteristics of test animals.

Fig. 2. Effects of insulin compensation on plasma IGF-I concentrations and liver IGF-I mRNA levels of rats fed a low protein diet.

Note: On days 1 and 7 after 16 h of starvation, rats were anesthetized and cardiac blood and liver were collected. Relative mRNA levels of liver IGF-I was measured by quantitative real-time PCR using β-actin as control (A). Plasma samples were prepared, and the IGF-I concentration was measured (B). Means ± standard errors are represented (n = 5). Results of two-way ANOVA for each day are given below the graph (*p < 0.05, ***p < 0.001, #p < 0.1).
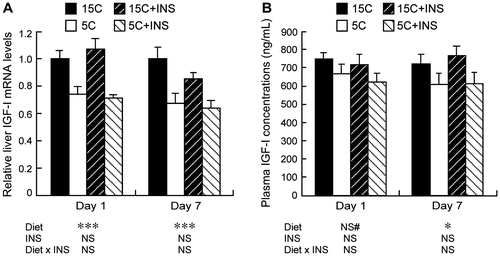
Fig. 2. Effects of insulin compensation on plasma IGF-I concentrations and liver IGF-I mRNA levels of rats fed a low protein diet.Note: On days 1 and 7 after 16 h of starvation, rats were anesthetized and cardiac blood and liver were collected. Relative mRNA levels of liver IGF-I was measured by quantitative real-time PCR using β-actin as control (A). Plasma samples were prepared, and the IGF-I concentration was measured (B). Means ± standard errors are represented (n = 5). Results of two-way ANOVA for each day are given below the graph (*p < 0.05, ***p < 0.001, #p < 0.1).

Fig. 3. Effect of insulin compensation on mRNA, and protein and tyrosine phosphorylation levels of IRS-1 in liver of rats fed a low protein diet.

Note: Liver samples were collected as described in the legend to Fig. . Relative mRNA levels of IRS-1 were measured by quantitative real-time PCR using β-actin as internal control (A). Means ± standard errors are represented (n = 5), and the results of two-way ANOVA are given below the graph. Crude protein extract was analyzed by immunoblotting with an anti-IRS-1 antibody (B). Immunoprecipitated IRS-1 was analyzed with an anti-phospho-tyrosine (PY) antibody (C). Typical results for two rats are shown (B and C). Numbers under lanes indicate relative band intensities with the leftmost lane taken to be 1.00.
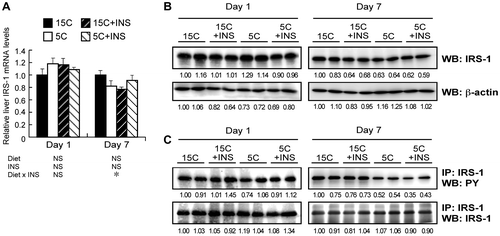
Fig. 3. Effect of insulin compensation on mRNA, and protein and tyrosine phosphorylation levels of IRS-1 in liver of rats fed a low protein diet.Note: Liver samples were collected as described in the legend to Fig. 1. Relative mRNA levels of IRS-1 were measured by quantitative real-time PCR using β-actin as internal control (A). Means ± standard errors are represented (n = 5), and the results of two-way ANOVA are given below the graph. Crude protein extract was analyzed by immunoblotting with an anti-IRS-1 antibody (B). Immunoprecipitated IRS-1 was analyzed with an anti-phospho-tyrosine (PY) antibody (C). Typical results for two rats are shown (B and C). Numbers under lanes indicate relative band intensities with the leftmost lane taken to be 1.00.
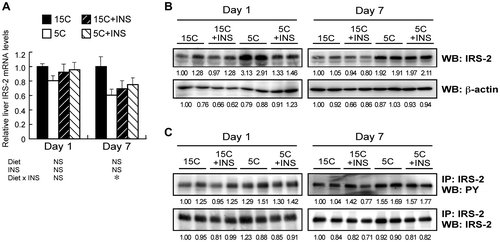
Fig. 4. Effect of insulin compensation on mRNA, protein, and tyrosine phosphorylation levels of IRS-2 in the liver of rats fed a low protein diet.

Note: Liver samples were collected as described in the legend to Fig. . Relative mRNA levels of IRS-2 were measured by quantitative real-time PCR using β-actin as internal control (A). Means ± standard errors are represented (n = 5), and the results of two-way ANOVA are given below the graph. Crude protein extract was analyzed by immunoblotting with an anti-IRS-2 antibody (B). Immunoprecipitated IRS-2 was analyzed with an anti-phospho-tyrosine (PY) antibody (C). Typical results for two rats are shown (B and C). Numbers under lanes indicate relative band intensities with the leftmost lane taken to be 1.00.

Fig. 4. Effect of insulin compensation on mRNA, protein, and tyrosine phosphorylation levels of IRS-2 in the liver of rats fed a low protein diet.Note: Liver samples were collected as described in the legend to Fig. 1. Relative mRNA levels of IRS-2 were measured by quantitative real-time PCR using β-actin as internal control (A). Means ± standard errors are represented (n = 5), and the results of two-way ANOVA are given below the graph. Crude protein extract was analyzed by immunoblotting with an anti-IRS-2 antibody (B). Immunoprecipitated IRS-2 was analyzed with an anti-phospho-tyrosine (PY) antibody (C). Typical results for two rats are shown (B and C). Numbers under lanes indicate relative band intensities with the leftmost lane taken to be 1.00.

Fig. 5. Effect of insulin deprivation on IRS-2 protein levels in H4IIE-C3 heptoma cells.

Note: H4IIE-C3 cells were cultured in insulin-deprived media for 0, 3, and 6 h, and IRS-2 protein was detected by immunoblotting.
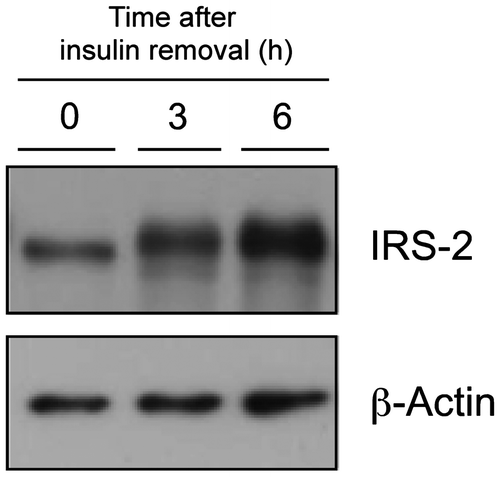
Fig. 5. Effect of insulin deprivation on IRS-2 protein levels in H4IIE-C3 heptoma cells.Note: H4IIE-C3 cells were cultured in insulin-deprived media for 0, 3, and 6 h, and IRS-2 protein was detected by immunoblotting.

Fig. 6. Effects of insulin compensation on liver triglyceride levels and plasma triglyceride concentrations of rats fed low protein diet.

Note: Liver and plasma samples were collected as described in the legend to Fig. . and triglyceride concentrations were measured. Means ± standard errors are represented (n = 5). Results of two-way ANOVA for each day are given below the graph (*p < 0.05, **p < 0.01, ***p < 0.001).
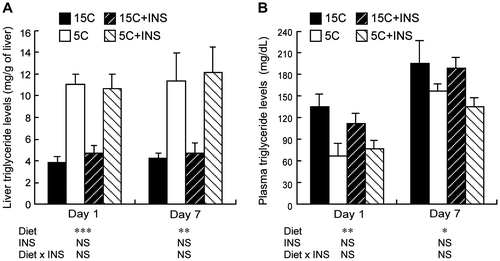
Fig. 6. Effects of insulin compensation on liver triglyceride levels and plasma triglyceride concentrations of rats fed low protein diet.Note: Liver and plasma samples were collected as described in the legend to Fig. 1. and triglyceride concentrations were measured. Means ± standard errors are represented (n = 5). Results of two-way ANOVA for each day are given below the graph (*p < 0.05, **p < 0.01, ***p < 0.001).

Reprints and Corporate Permissions

Please note: Selecting permissions does not provide access to the full text of the article, please see our help page How do I view content?

To request a reprint or corporate permissions for this article, please click on the relevant link below:

Academic Permissions

Please note: Selecting permissions does not provide access to the full text of the article, please see our help page How do I view content?

Obtain permissions instantly via Rightslink by clicking on the button below:

If you are unable to obtain permissions via Rightslink, please complete and submit this Permissions form. For more information, please visit our Permissions help page.