1,376
Views
2
CrossRef citations to date
0
Altmetric
Biochemistry & Molecular Biology

Live-cell imaging of HP1α throughout the cell cycle of mouse C3H10T1/2 cells and rhythmical flickering of heterochromatin dots in interphase

, , &
Pages 556-564 | Received 24 Jun 2013, Accepted 06 Dec 2013, Published online: 09 May 2014

Figures & data

Fig. 1. Expression of DsRed-HP1α in C3H10T1/2 cells.

Notes: HP1α protein was detected on a western blot of whole lysates from C3H10T1/2 cells (lane 1) and C3H10T1/2 cells stably expressing DsRed-HP1α (lane 2).
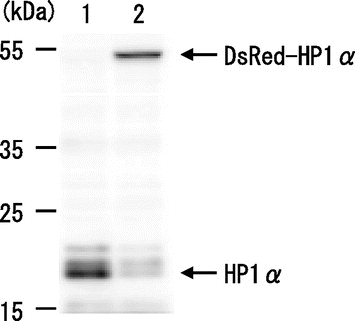
Fig. 1. Expression of DsRed-HP1α in C3H10T1/2 cells.Notes: HP1α protein was detected on a western blot of whole lysates from C3H10T1/2 cells (lane 1) and C3H10T1/2 cells stably expressing DsRed-HP1α (lane 2).

Fig. 2. Molecular behavior of DsRed-HP1α during the cell cycle of C3H10T1/2 cells.

Notes: (A) Fluorescent images of a C3H10T1/2 cell through two successive cell divisions. Each image of C3H10T1/2 cells stably expressing DsRed-HP1α was captured at 6 min intervals. The elapsed time after anaphase of the first mitosis is indicated at the bottom. The second mitosis began after 1962 min. Only one of the daughter cells (lower right) is shown after 60 min. (B) Fluorescence intensity of DsRed-HP1α following its diffusion into the nucleoplasm. The fluorescence intensity of nucleoplasm was measured at 6 min intervals and is indicated by arbitrary units. Note that the fluorescence intensity suddenly decreased at 1962 min, concomitant with nuclear envelope breakdown in the second mitosis. Segmentation of Phases 1–4 is shown at the top.
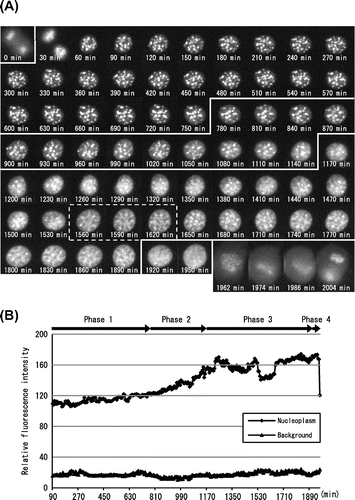
Fig. 2. Molecular behavior of DsRed-HP1α during the cell cycle of C3H10T1/2 cells.Notes: (A) Fluorescent images of a C3H10T1/2 cell through two successive cell divisions. Each image of C3H10T1/2 cells stably expressing DsRed-HP1α was captured at 6 min intervals. The elapsed time after anaphase of the first mitosis is indicated at the bottom. The second mitosis began after 1962 min. Only one of the daughter cells (lower right) is shown after 60 min. (B) Fluorescence intensity of DsRed-HP1α following its diffusion into the nucleoplasm. The fluorescence intensity of nucleoplasm was measured at 6 min intervals and is indicated by arbitrary units. Note that the fluorescence intensity suddenly decreased at 1962 min, concomitant with nuclear envelope breakdown in the second mitosis. Segmentation of Phases 1–4 is shown at the top.

Fig. 3. Interphase segmentation of C3H10T1/2 cells.

Notes: (A) Typical cell images of C3H10T1/2 cells in Phases 1–4. Interphase was divided into four phases by the pattern of DsRed-HP1α diffusion into the nucleoplasm. Heterochromatin dots of DsRed-HP1α were clearly observed 60 min after cell division (Phase 1). DsRed-HP1α began to diffuse into the nucleoplasm (Phase 2). The extent of DsRed-HP1α diffusion increased gradually and reached a plateau (see Fig. (B)). DsRed-HP1α diffused further towards the nuclear periphery (Phase 3) and uniformly diffused into the entire nucleoplasm (Phase 4). The elapsed time is indicated at the bottom. Each image from Phase 1 represents 90 min, by which time the heterochromatin dots were completely formed. Images of the start points of Phase 2 (600–870 min), Phase 3 (870–1200 min), and Phase 4 (1500–1920 min) are shown. (B) Ratio of the four phases in the cell cycle of C3H10T1/2 cells. In the diagram, the cell cycle of 14 cells starts from the first mitosis (M). Times required for one cell cycle in each cell are shown on the right. Note that Phase 2 is roughly positioned in the middle of the cell cycle.
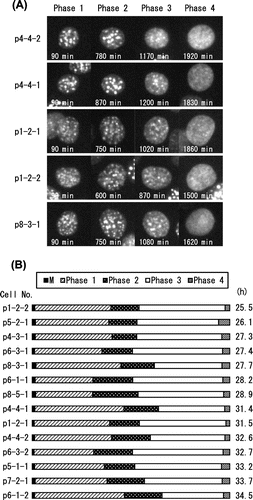
Fig. 3. Interphase segmentation of C3H10T1/2 cells.Notes: (A) Typical cell images of C3H10T1/2 cells in Phases 1–4. Interphase was divided into four phases by the pattern of DsRed-HP1α diffusion into the nucleoplasm. Heterochromatin dots of DsRed-HP1α were clearly observed 60 min after cell division (Phase 1). DsRed-HP1α began to diffuse into the nucleoplasm (Phase 2). The extent of DsRed-HP1α diffusion increased gradually and reached a plateau (see Fig. 2(B)). DsRed-HP1α diffused further towards the nuclear periphery (Phase 3) and uniformly diffused into the entire nucleoplasm (Phase 4). The elapsed time is indicated at the bottom. Each image from Phase 1 represents 90 min, by which time the heterochromatin dots were completely formed. Images of the start points of Phase 2 (600–870 min), Phase 3 (870–1200 min), and Phase 4 (1500–1920 min) are shown. (B) Ratio of the four phases in the cell cycle of C3H10T1/2 cells. In the diagram, the cell cycle of 14 cells starts from the first mitosis (M). Times required for one cell cycle in each cell are shown on the right. Note that Phase 2 is roughly positioned in the middle of the cell cycle.

Fig. 4. Asynchronous periodic flickering of DsRed-HP1α dots in Phase 2.

Notes: (A) Representative images of DsRed-HP1α dots in interphase nuclei in Phases 1 and 2. The relative positions of DsRed-HP1α dots did not change significantly between 630 and 738 min (a, Phase 1), but did between 858 and 996 min (b, Phase 2). The insets show higher magnification images of the HP1α dots marked with a square. Note that the HP1α dot in Phase 2 appears and disappears periodically with an interval of about 30 min. (B) Fluorescence intensity of a DsRed-HP1α dot. The fluorescence intensity of the HP1α dot indicated with a square in Fig. A was measured at 6 min intervals. Each boxed area (a and b) corresponds to the cell panels in Fig. A. Note that the fluorescence intensity of HP1α suddenly changed at 780 min, concomitant with the beginning of Phase 2. The fluorescence intensity of this dot could not be measured after 1086 min. (C) DsRed-HP1α dots applied for measurement of fluorescence intensity. Five DsRed-HP1α dots that flickered periodically are indicated with circles on the image captured at 858 min. The background intensity was also measured (upper right circle). (D) Change in fluorescence intensity of HP1α dots. The fluorescence intensities of the DsRed-HP1α dots shown in Fig. C were measured at 6 min intervals. The first decreases in fluorescence intensity were observed at 756 (Dot 4), 768 (Dot 5), 822 (Dot 3), 864 (Dot 2), and 888 min (Dot 1), concomitant with the initiation of Phase 2 (780 min). Dots 1–5 showed a similar periodicity of flickering, although the fluorescence intensity of Dot 5 could not be followed after 948 min.
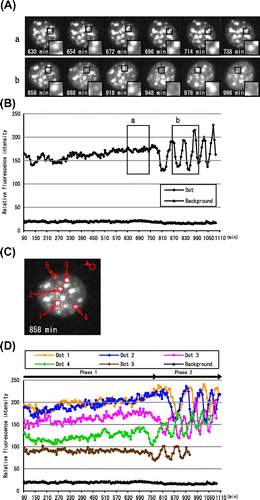
Fig. 4. Asynchronous periodic flickering of DsRed-HP1α dots in Phase 2.Notes: (A) Representative images of DsRed-HP1α dots in interphase nuclei in Phases 1 and 2. The relative positions of DsRed-HP1α dots did not change significantly between 630 and 738 min (a, Phase 1), but did between 858 and 996 min (b, Phase 2). The insets show higher magnification images of the HP1α dots marked with a square. Note that the HP1α dot in Phase 2 appears and disappears periodically with an interval of about 30 min. (B) Fluorescence intensity of a DsRed-HP1α dot. The fluorescence intensity of the HP1α dot indicated with a square in Fig. A was measured at 6 min intervals. Each boxed area (a and b) corresponds to the cell panels in Fig. A. Note that the fluorescence intensity of HP1α suddenly changed at 780 min, concomitant with the beginning of Phase 2. The fluorescence intensity of this dot could not be measured after 1086 min. (C) DsRed-HP1α dots applied for measurement of fluorescence intensity. Five DsRed-HP1α dots that flickered periodically are indicated with circles on the image captured at 858 min. The background intensity was also measured (upper right circle). (D) Change in fluorescence intensity of HP1α dots. The fluorescence intensities of the DsRed-HP1α dots shown in Fig. C were measured at 6 min intervals. The first decreases in fluorescence intensity were observed at 756 (Dot 4), 768 (Dot 5), 822 (Dot 3), 864 (Dot 2), and 888 min (Dot 1), concomitant with the initiation of Phase 2 (780 min). Dots 1–5 showed a similar periodicity of flickering, although the fluorescence intensity of Dot 5 could not be followed after 948 min.

Fig. 6. Schematic illustration of the molecular behavior of HP1α during the cell cycle.

Notes: In Phase 1, HP1α formed heterochromatin dots in the nucleus after the first cell division. In Phase 2, HP1α began to diffuse in the nucleoplasm, and HP1α dots started flickering periodically. HP1α dots that disappeared because of periodic flickering are shown by the dotted circles. Note that periodic flickering of HP1α dots is asynchronous. In Phase 3, HP1α diffused further towards the nuclear periphery, and the HP1α dots became difficult to distinguish. In Phase 4, HP1α was distributed completely in the nucleus. In M phase (M), the majority of HP1α diffused into the cytoplasm but some remained in centromere heterochromatin as described previously.Citation17)
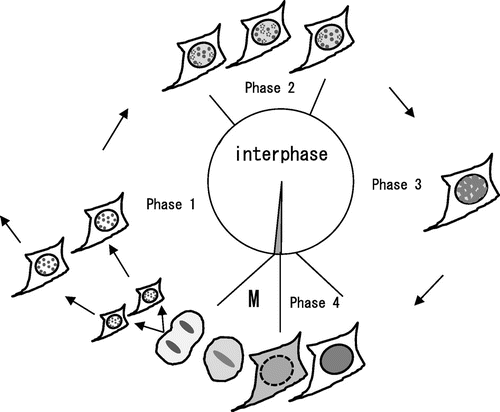
Fig. 6. Schematic illustration of the molecular behavior of HP1α during the cell cycle.Notes: In Phase 1, HP1α formed heterochromatin dots in the nucleus after the first cell division. In Phase 2, HP1α began to diffuse in the nucleoplasm, and HP1α dots started flickering periodically. HP1α dots that disappeared because of periodic flickering are shown by the dotted circles. Note that periodic flickering of HP1α dots is asynchronous. In Phase 3, HP1α diffused further towards the nuclear periphery, and the HP1α dots became difficult to distinguish. In Phase 4, HP1α was distributed completely in the nucleus. In M phase (M), the majority of HP1α diffused into the cytoplasm but some remained in centromere heterochromatin as described previously.Citation17)
Supplemental material

Supplemental Video S3

Download MP4 Video (1.3 MB)

Reprints and Corporate Permissions

Please note: Selecting permissions does not provide access to the full text of the article, please see our help page How do I view content?

To request a reprint or corporate permissions for this article, please click on the relevant link below:

Academic Permissions

Please note: Selecting permissions does not provide access to the full text of the article, please see our help page How do I view content?

Obtain permissions instantly via Rightslink by clicking on the button below:

If you are unable to obtain permissions via Rightslink, please complete and submit this Permissions form. For more information, please visit our Permissions help page.