Figures & data
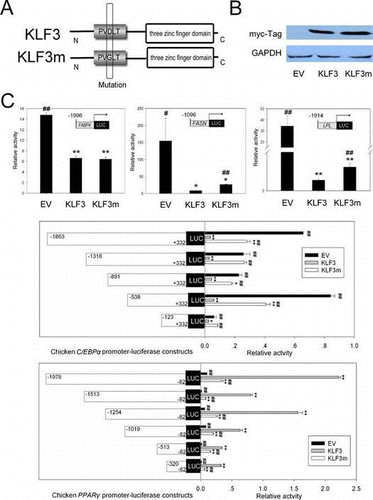
Table 1. Primers used in RT-qPCR.
Table 2. The transfection system of plasmids in one well.
Fig. 1. Alignment of KLF3 protein sequences.
Notes: The Align X program in Vector NTI Advance 11 (Invitrogen) was used to align the KLF3 protein sequences, gKLF3, gKLF3 (cloned), and hKLF3 and mKLF3 referred to the present chicken predicted KLF3 protein sequence (GenBank accession XP_427367.3), the KLF3 protein sequence deduced from our sequencing result (GenBank accession JX673910), the human KLF3 protein sequence (GenBank accession NP_057615.3), and the murine KLF3 protein sequence (GenBank accession NP_032479.1), respectively.
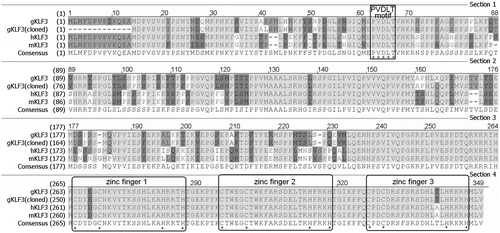
Fig. 2. Tissue expression characterization of KLF3 in 7-week-old broilers.
Notes: KLF3 mRNA expression in various tissues of 7-week-old NEAUHLF male broilers (each line, n = 3) was detected by real-time RT-PCR. GAPDH (glyceraldehyde-3-phosphate dehydrogenase) was used as a reference gene. (A) The diagrams show the relative quantification of KLF3 transcripts in a given tissue. Error bars indicate the standard deviations of six biological replicates. (B) The diagrams show the relative quantification of KLF3 transcripts in a given line and tissue. Error bars indicate the standard deviations of three biological replicates. Asterisks indicate a significant difference between fat and lean broilers, p < 0.05 (*) or p < 0.01 (**).
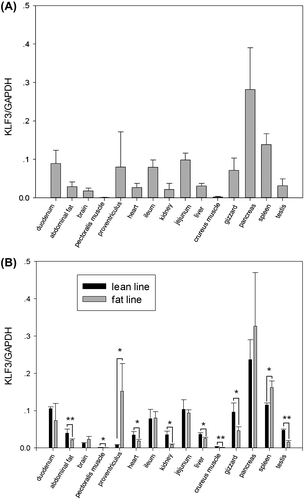
Fig. 3. Expression characterization of KLF3 in abdominal fat tissue of NEAUHLF broiler lines.
Notes: KLF3 mRNA expression in abdominal fat tissue of male broilers at various ages (each age, each line, n = 3–6) was analyzed by real-time RT-PCR. Chicken GAPDH and β-actin were used as internal controls. The diagram shows the relative quantification of KLF3 mRNA expression. Error bars indicate the standard deviation of KLF3 mRNA expression among individuals of the same age and line. Asterisks indicate significant differences between fat and lean broilers p < 0.05 (*) or p < 0.01 (**), 1–12 w = 1–12 weeks of age.
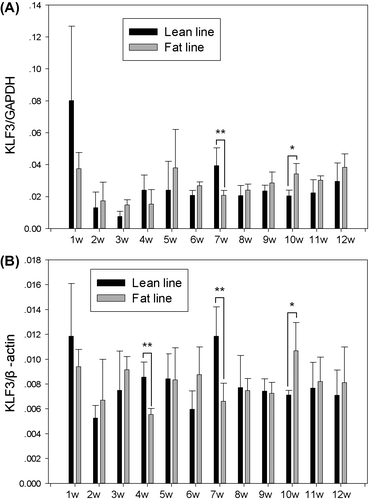
Fig. 4. Effects of KLF3 overexpression on the promoter activities of chicken FABP4, FASN, LPL, C/EBPα, and PPARγ in DF1 cells.
Notes: (A) Schematic diagram of chicken KLF3 and its mutant, KLF3m. (B) Western blot analysis of KLF3 and KLF3 mutant in DF1 cells transfected with pCMV-myc (empty vector, EV), pCMV-myc-gKLF3, and pCMV-myc-gKLF3m. (C) Effects of KLF3 and KLF3m overexpression on the promoter activities of chicken FABP4, FASN, LPL, C/EBPα, and PPARγ. Luciferase assays were conducted in DF1 cells cultured in 12-well dishes. Promoter activities are expressed as ratios of firefly/renilla luciferase activity. Asterisks indicate significant differences between the other groups and the control group, which was transfected with pCMV-myc (empty vector, EV) (*p < 0.05; **p < 0.01). The number signs indicate significant differences between the other groups and the group transfected with pCMV-myc-gKLF3 (KLF3) (#p < 0.05; ##p < 0.01). EV indicates the control group that was transfected with pCMV-myc, KLF3 indicates the group transfected with pCMV-myc-gKLF3, and KLF3m indicates the group transfected with pCMV-myc-gKLF3m.
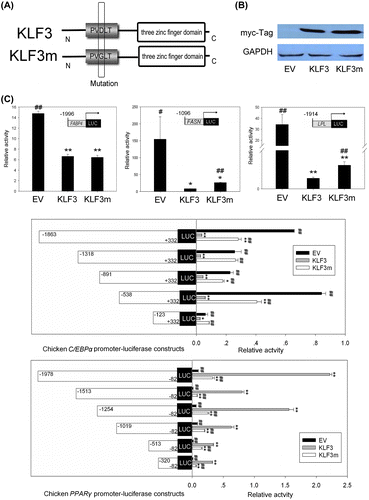
Fig. 5. Effects of KLF3 overexpression on the promoter activities of chicken C/EBPα, PPARγ, FABP4, FASN, and LPL in chicken preadipocytes.
Notes: Luciferase assays were conducted in chicken preadipocytes cultured in 12-well dishes. Promoter activities are expressed as ratios of firefly/renilla luciferase activity. Asterisks indicate significant differences between the other groups and the control group, which was transfected with pCMV-myc (empty vector, EV) (*p < 0.05; **p < 0.01). The number signs indicate significant differences between the other groups and the group transfected with pCMV-myc-gKLF3 (KLF3) (#p < 0.05; ##p < 0.01). EV indicates the control group that was transfected with pCMV-myc, KLF3 indicates the group transfected with pCMV-myc-gKLF3, and KLF3m indicates the group transfected with pCMV-myc-gKLF3m.
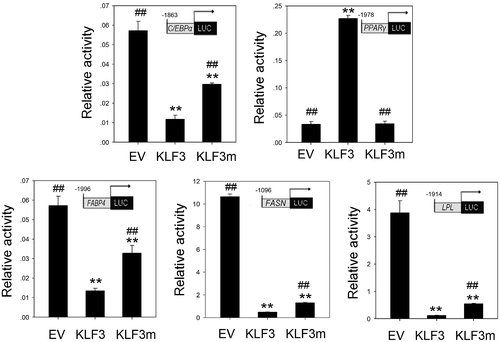
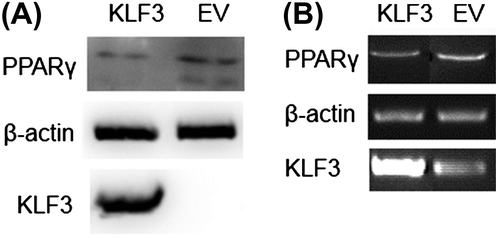
Fig. 6. Effects of KLF3 overexpression on the expression of chicken PPARγ in DF1 cells.
Notes: (A) Western blot analysis of the effect of chicken KLF3 overexpression on the expression of PPARγ in DF1 cells. (B) Semi-quantitative RT-PCR analysis of the effect of chicken KLF3 overexpression on the expression of PPARγ in DF1 cells. EV indicates the control group that was transfected with pCMV-myc, and KLF3 indicates the group transfected with pCMV-myc-gKLF3.