
Figures & data
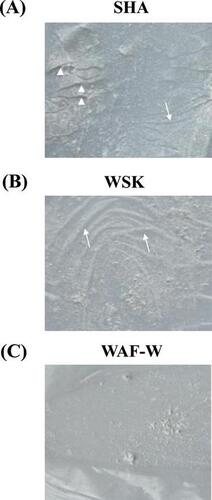
Fig. 1. DPPH radical-scavenging activity levels of The EAF-W, WAF-W, and WSK samples.
Notes: Vitamin C served as the positive control. The values are expressed as means ± SD (=3). The lowercase letters above the bars at the same concentration indicate a significant difference (p < 0.05).
Fig. 2. Reducing power of the EAF-W, WAF-W, and WSK samples.
Notes: Vitamin C served as the positive control. The values are expressed as means ± SD (n = 3). The lowercase letters above the bars of the four samples at the same concentration indicate a significant difference (p < 0.05).
Fig. 3. Ferrous ion chelating capacity of the EAF-W, WAF-W, and WSK samples.
Notes: EDTA-2Na served as the positive control. The values are expressed as means ± SD (n = 3). The lowercase letters above the bars of the four samples at the same concentration indicate a significant difference (p < 0.05).
Fig. 4. Scavenging activity levels of the superoxide radicals of the EAF-W, WAF-W, and WSK samples.
Notes: Vitamin C served as the positive control. The values are expressed as means ± SD (n = 3). The lowercase letters above the bars of the four samples at the same concentration indicate a significant difference (p < 0.05).
Fig. 5. Moisture-retention and evaporation rates of SHA, WSK, WAF-W solutions, and water.
Notes: (A) Kinetic moisture-retention capacity of the 2 mg/mL SHA, WSK, WAF-W solutions, and water at 25 min; and (B) the time required for 50% of sample to evaporate. The values are expressed as means ± SD (n = 3). The samples with different lowercase letters indicate a significant difference (p < 0.05).
Fig. 6. Surface Morphologies of the Forming SHA, WSK, and WAF-W films at 25 °C and 48% RH for 4 h.
Notes: (A) Corrugation (arrow) and fissures (arrow head) were observed on the SHA film; (B) Only corrugation (arrow) was observed on the WSK film; and (C) no corrugation or fissures were observed on the WAF-W film.
Fig. 7. Film contraction assay of the forming SHA, WSK, and WAF-W films.
Notes: The film areas at RH 88% were recognized as 100% (empty bars). The relative film contraction areas were measured at RH 23% (gray bars). The values are expressed as means ± SD (n = 3). The lowercase letters above the bars indicate a significant difference (p < 0.05).
Fig. 8 Effects of temperature and concentrations on the viscosities of the SHA, WSK, and WAF-W fluids.
Notes: The viscosities of the 1 mg/mL (empty), 3 mg/mL (gray), and 5 mg/mL (black) SHA, WSK, and WAF-W fluids were measured when the temperature was raised from 25 to 60, 80, and 100 °C ((A)–(C)). The values are expressed as means ± SD (n = 3). The viscosity loss was determined by comparing with the viscosity at 25 °C ((D)–(F)).