576
Views
0
CrossRef citations to date
0
Altmetric
Biochemistry & Molecular Biology

Dynamic changes in genes related to glucose uptake and utilization during pig skeletal and cardiac muscle development

, , , , , & show all
Pages 1159-1166 | Received 23 Nov 2013, Accepted 12 Feb 2014, Published online: 28 May 2014

Figures & data

Table 1. The biological process enrichment of genes in significant expression pattern.

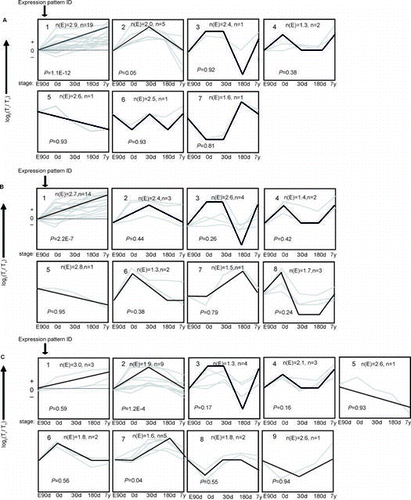
Fig. 1. The trends of 30 mRNA were divided into groups according to their dynamic expression patterns at the age of embryonic day 90 (E90d), postnatal day 0 (0d), day 30 (30d), day 180 (180d), and 7 years (7y) for (A) cardiac muscle, (B) longissimus dorsi Muscle, and (C) psoas major Muscle.

Notes: The dashed line indicates no change in expression at different age stages. The number in the top left corner of each square indicates the expression pattern ID. The blank, bold lines in the squares are trendlines of the expression patterns, and the gray lines represent gene expression from embryonic day 90 to 7 years postnatally. The p value is the corrected p value between the number of genes expected (n(E)) and the number of genes assigned (n), with p values < 0.05 considered to be statistically significant. Four other expressions were normalized to the highest one in four stages firstly, and then all expressions were log2-transformed.
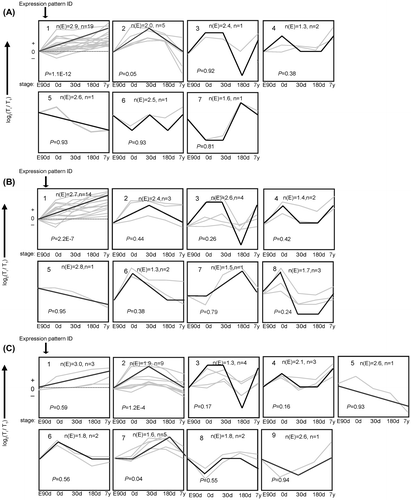
Fig. 1. The trends of 30 mRNA were divided into groups according to their dynamic expression patterns at the age of embryonic day 90 (E90d), postnatal day 0 (0d), day 30 (30d), day 180 (180d), and 7 years (7y) for (A) cardiac muscle, (B) longissimus dorsi Muscle, and (C) psoas major Muscle.Notes: The dashed line indicates no change in expression at different age stages. The number in the top left corner of each square indicates the expression pattern ID. The blank, bold lines in the squares are trendlines of the expression patterns, and the gray lines represent gene expression from embryonic day 90 to 7 years postnatally. The p value is the corrected p value between the number of genes expected (n(E)) and the number of genes assigned (n), with p values < 0.05 considered to be statistically significant. Four other expressions were normalized to the highest one in four stages firstly, and then all expressions were log2-transformed.

Fig. 2. Gene expression related to glycolysis in cardiac and skeletal muscle during development.

Notes: Triose phosphate isomerase 1 (TPI1), muscle phosphofructokinase (PFKM), and monocarboxylate transporter 4 (MCT-4) are important glycolytic enzymes that are mainly expressed in white muscle, and significantly up-regulated in LDM compared with CM and PMM in the study. The data were normalized to the highest expression of the three muscles and presented as mean ± SD. n = 3 for each age stages of tissues. CM, cardiac muscle; LDM, longissimus dorsi muscle; PMM, psoas major muscles.

**p < 0.01, *p < 0.05.

Fig. 2. Gene expression related to glycolysis in cardiac and skeletal muscle during development.Notes: Triose phosphate isomerase 1 (TPI1), muscle phosphofructokinase (PFKM), and monocarboxylate transporter 4 (MCT-4) are important glycolytic enzymes that are mainly expressed in white muscle, and significantly up-regulated in LDM compared with CM and PMM in the study. The data were normalized to the highest expression of the three muscles and presented as mean ± SD. n = 3 for each age stages of tissues. CM, cardiac muscle; LDM, longissimus dorsi muscle; PMM, psoas major muscles.**p < 0.01, *p < 0.05.

Fig. 3. Gene expression related to oxidation in cardiac and skeletal muscle during development.

Notes: ATPase-ß, citrate synthase (CS), and pyruvate dehydrogenase (PDH1) are related to mitochondrial oxidation, which were up-regulated in PMM compared with CM and LDM in this study. The data were normalized to the highest expression of the three muscles and presented as mean ± SD. n = 3 for each age stages of tissues. CM: cardiac muscle, LDM, longissimus dorsi muscle, PMM: psoas major muscle.

**p < 0.01, *p < 0.05.

Fig. 3. Gene expression related to oxidation in cardiac and skeletal muscle during development.Notes: ATPase-ß, citrate synthase (CS), and pyruvate dehydrogenase (PDH1) are related to mitochondrial oxidation, which were up-regulated in PMM compared with CM and LDM in this study. The data were normalized to the highest expression of the three muscles and presented as mean ± SD. n = 3 for each age stages of tissues. CM: cardiac muscle, LDM, longissimus dorsi muscle, PMM: psoas major muscle.**p < 0.01, *p < 0.05.

Fig. 4. The trends of 10 miRNA were divided into groups according to heir dynamic expression patterns for (A) Cardiac Muscle, (B) longissimus dorsi Muscle, and (C) psoas major muscles at the age of embryonic day 90 (E90d), postnatal day 0 (0d), day 30 (30d), day 180 (180d), and 7 years (7y).

Notes: The dashed line indicates no change in expression among different stages. The number in the top left corner of each square is the expression pattern ID. The blank, bold lines in the squares are trendlines of the expression patterns, and the gray lines represent gene expression from embryonic day 90 to 7 years postnatally. The p-value is the corrected P-value between the number of genes expected (n(E)) and the number of genes assigned (n), with p values < 0.05 considered to be statistically significant. Four other expressions were normalized to the highest one in four stages firstly, and then all expressions were log2-transformed.
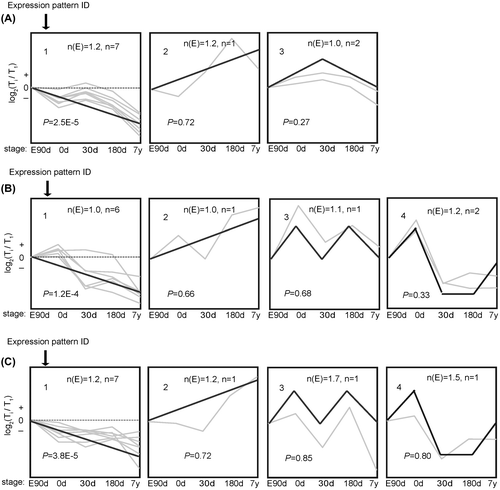
Fig. 4. The trends of 10 miRNA were divided into groups according to heir dynamic expression patterns for (A) Cardiac Muscle, (B) longissimus dorsi Muscle, and (C) psoas major muscles at the age of embryonic day 90 (E90d), postnatal day 0 (0d), day 30 (30d), day 180 (180d), and 7 years (7y).Notes: The dashed line indicates no change in expression among different stages. The number in the top left corner of each square is the expression pattern ID. The blank, bold lines in the squares are trendlines of the expression patterns, and the gray lines represent gene expression from embryonic day 90 to 7 years postnatally. The p-value is the corrected P-value between the number of genes expected (n(E)) and the number of genes assigned (n), with p values < 0.05 considered to be statistically significant. Four other expressions were normalized to the highest one in four stages firstly, and then all expressions were log2-transformed.

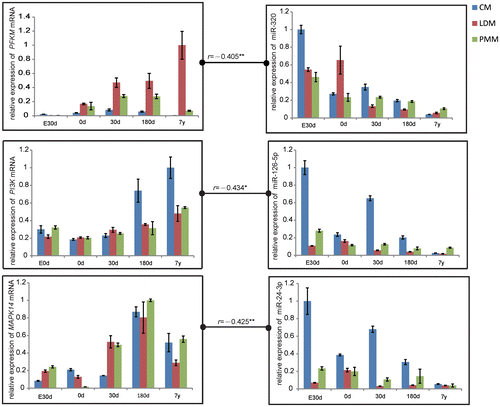
Fig. 5. Correlation in Gene Expression between PFKM and miR-320, PI3 K and miR-126, MAPK and miR-24 at the Stage of Embryonic day 90 (E90d), Postnatal day 0 (0 d), Day 30 (30d), Day 180 (180d), and 7 years (7y).

Notes: The data were normalized to the highest expression of the three muscles and presented as mean ± SD. n = 3 for each age stages of tissues. CM, cardiac muscle; LDM, longissimus dorsi muscle; PMM, psoas major muscles.

**p <0.01, *p < 0.05.

Fig. 5. Correlation in Gene Expression between PFKM and miR-320, PI3 K and miR-126, MAPK and miR-24 at the Stage of Embryonic day 90 (E90d), Postnatal day 0 (0 d), Day 30 (30d), Day 180 (180d), and 7 years (7y).Notes: The data were normalized to the highest expression of the three muscles and presented as mean ± SD. n = 3 for each age stages of tissues. CM, cardiac muscle; LDM, longissimus dorsi muscle; PMM, psoas major muscles.**p < 0.01, *p < 0.05.
Supplemental material

Supplemental Tables 1-3 and Figs. 1 and 2

Download PDF (395.4 KB)

Reprints and Corporate Permissions

Please note: Selecting permissions does not provide access to the full text of the article, please see our help page How do I view content?

To request a reprint or corporate permissions for this article, please click on the relevant link below:

Academic Permissions

Please note: Selecting permissions does not provide access to the full text of the article, please see our help page How do I view content?

Obtain permissions instantly via Rightslink by clicking on the button below:

If you are unable to obtain permissions via Rightslink, please complete and submit this Permissions form. For more information, please visit our Permissions help page.