682
Views
5
CrossRef citations to date
0
Altmetric
Food & Nutrition Science

Protective effects of oral administration of yeast thioredoxin against gastric mucosal injury

, , , , , , , , & show all
Pages 1221-1230 | Received 11 Jan 2014, Accepted 20 Feb 2014, Published online: 18 Jun 2014

Figures & data

Fig. 1. The digestibility of yeast TRX in the stomach of the mouse.

Notes: Recombinant yeast TRX was administered orally to mice at a dosage of 100 mg/kg body weight in a 0.85% NaCl solution. At 1, 2, 4, 6, and 24 h after administration, the stomachs were excised from the mice. Yeast TRX in the stomach contents were detected by the western blot method (A). Yeast TRX in the gastric walls was detected by immunoprecipitation and the western blot method (B). Ten nanograms of recombinant yeast TRX was loaded as a control for detection.
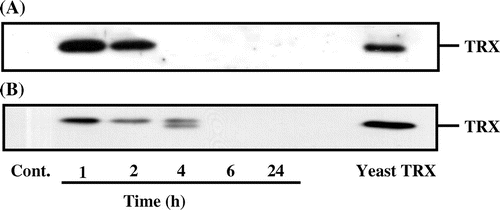
Fig. 1. The digestibility of yeast TRX in the stomach of the mouse.Notes: Recombinant yeast TRX was administered orally to mice at a dosage of 100 mg/kg body weight in a 0.85% NaCl solution. At 1, 2, 4, 6, and 24 h after administration, the stomachs were excised from the mice. Yeast TRX in the stomach contents were detected by the western blot method (A). Yeast TRX in the gastric walls was detected by immunoprecipitation and the western blot method (B). Ten nanograms of recombinant yeast TRX was loaded as a control for detection.

Fig. 2. The effects of recombinant yeast TRX on ethanol-induced cytotoxicity in RGM-1 cells.

Notes: (A) Time course of the LDH release. RGM-1 cells were incubated with 10% ethanol and 10−7m recombinant yeast TRX for the time period required. (B) Relative cytotoxicity. The cells were incubated with 10% ethanol and 10−8 or 10−7m recombinant yeast TRX, or 10−7m thermal denatured recombinant yeast TRX for 35 min. Panel (A) shows the result of a representative experiment. In panel (B), the relative cytotoxicity (%) is shown relative to the cytotoxicity of the control cells (set as 100%) as an average value from 3 independent experiments. The values are given as mean ± SD. The data were analyzed using two-sided one-sample Student’s t tests. The * symbol indicates values significantly different from those for cells incubated without yeast TRX at p < 0.05. (C) Time course of the remaining reducing activity. Yeast TRX was incubated with 10% ethanol for the time period required. (D) Remaining reducing activity of native and thermally denatured TRX. Yeast TRX was denatured at 100 °C for 20 min. The remaining activity (%) was measured by an assay of the TRX reducing activity.
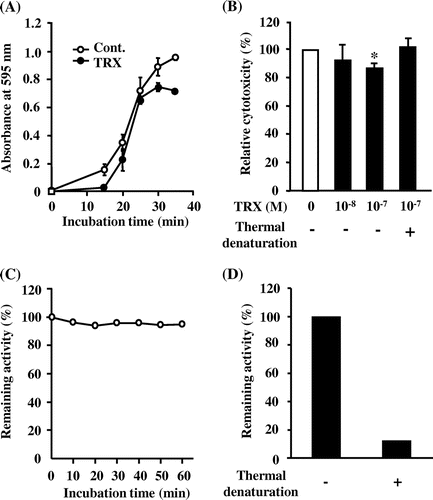
Fig. 2. The effects of recombinant yeast TRX on ethanol-induced cytotoxicity in RGM-1 cells.Notes: (A) Time course of the LDH release. RGM-1 cells were incubated with 10% ethanol and 10−7 m recombinant yeast TRX for the time period required. (B) Relative cytotoxicity. The cells were incubated with 10% ethanol and 10−8 or 10−7 m recombinant yeast TRX, or 10−7 m thermal denatured recombinant yeast TRX for 35 min. Panel (A) shows the result of a representative experiment. In panel (B), the relative cytotoxicity (%) is shown relative to the cytotoxicity of the control cells (set as 100%) as an average value from 3 independent experiments. The values are given as mean ± SD. The data were analyzed using two-sided one-sample Student’s t tests. The * symbol indicates values significantly different from those for cells incubated without yeast TRX at p < 0.05. (C) Time course of the remaining reducing activity. Yeast TRX was incubated with 10% ethanol for the time period required. (D) Remaining reducing activity of native and thermally denatured TRX. Yeast TRX was denatured at 100 °C for 20 min. The remaining activity (%) was measured by an assay of the TRX reducing activity.

Fig. 3. The effects of yeast TRX on WRS-induced gastric ulcers.

Notes: Lesion indexes (A) and the number of gastric ulcer lesions (B) in rats pre-treatment or post-treatment with the administration of recombinant yeast TRX in a 0.85% NaCl solution, OVA in a 0.85% NaCl solution, or a 0.85% NaCl solution alone. The animals employed as a negative control group were administered with a 0.85% NaCl solution alone and not exposed to WRS. The values are given as mean ± SD (n = 5). The *symbols indicate values significantly different at p < 0.05. The **symbol indicates values significantly different at p < 0.01. ND: not detected. (C) Pictures of excised stomachs from rats in the post-treatment groups.
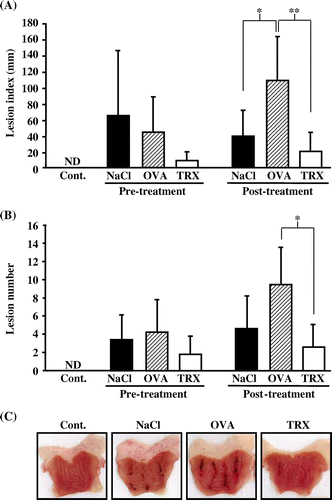
Fig. 3. The effects of yeast TRX on WRS-induced gastric ulcers.Notes: Lesion indexes (A) and the number of gastric ulcer lesions (B) in rats pre-treatment or post-treatment with the administration of recombinant yeast TRX in a 0.85% NaCl solution, OVA in a 0.85% NaCl solution, or a 0.85% NaCl solution alone. The animals employed as a negative control group were administered with a 0.85% NaCl solution alone and not exposed to WRS. The values are given as mean ± SD (n = 5). The *symbols indicate values significantly different at p < 0.05. The **symbol indicates values significantly different at p < 0.01. ND: not detected. (C) Pictures of excised stomachs from rats in the post-treatment groups.

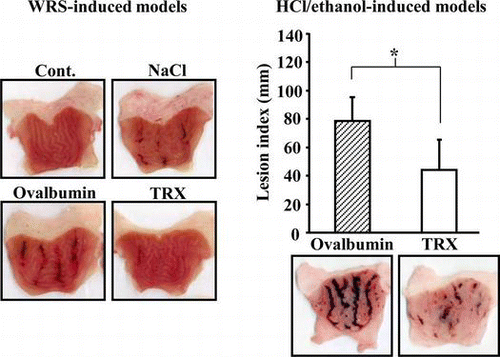
Fig. 4. The effects of yeast TRX on HCl/ethanol-induced gastric ulcers.

Notes: (A) Lesion indexes of gastric ulcer (upper figure) and pictures of excised stomachs (lower figure) in recombinant yeast TRX in a 0.85% NaCl solution or a 0.85% NaCl solution alone administered rats (n = 10 in each group). (B) Lesion indexes of gastric ulcer (upper figure) and pictures of excised stomachs (lower figure) in recombinant yeast TRX in a 0.85% NaCl solution (n = 6) or OVA in a 0.85% NaCl solution (n = 5) administered rats. The values are given as mean ± SD. The *symbol indicates values significantly different at p < 0.05.
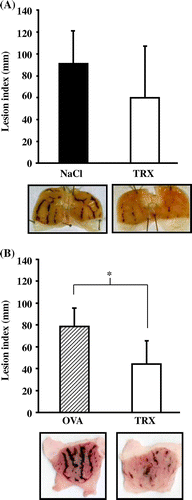
Fig. 4. The effects of yeast TRX on HCl/ethanol-induced gastric ulcers.Notes: (A) Lesion indexes of gastric ulcer (upper figure) and pictures of excised stomachs (lower figure) in recombinant yeast TRX in a 0.85% NaCl solution or a 0.85% NaCl solution alone administered rats (n = 10 in each group). (B) Lesion indexes of gastric ulcer (upper figure) and pictures of excised stomachs (lower figure) in recombinant yeast TRX in a 0.85% NaCl solution (n = 6) or OVA in a 0.85% NaCl solution (n = 5) administered rats. The values are given as mean ± SD. The *symbol indicates values significantly different at p < 0.05.

Fig. 5. DNA microarray analysis of HCl/ethanol-induced gastric ulcers in rats.

Notes: (A) The method employed for the DNA microarray experiment. Two groups of rats were administered with recombinant yeast TRX in a 0.85% NaCl solution or a 0.85% NaCl solution alone and gastric mucosal injuries were induced by HCl/ethanol. Stomachs were excised from the rats, and separated into ulcerated and non-ulcerated regions. RNA extraction and DNA Microarray procedures were performed for each separate sample. (B) Scatter plot of gene expression values (log2 ratios of ulcerated vs. non-ulcerated regions) in two groups. The x-axis: rats that ingested a 0.85% NaCl solution alone, the y-axis: rats that ingested yeast TRX. The red and green spots respectively depict significantly higher and lower expressed genes in rats that ingested yeast TRX, compared to rats that ingested a 0.85% NaCl solution alone.
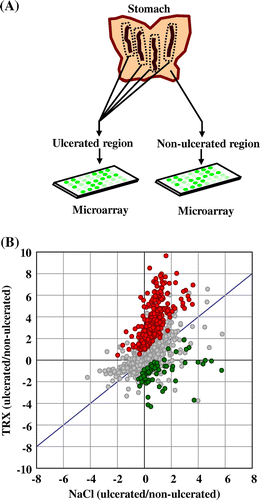
Fig. 5. DNA microarray analysis of HCl/ethanol-induced gastric ulcers in rats.Notes: (A) The method employed for the DNA microarray experiment. Two groups of rats were administered with recombinant yeast TRX in a 0.85% NaCl solution or a 0.85% NaCl solution alone and gastric mucosal injuries were induced by HCl/ethanol. Stomachs were excised from the rats, and separated into ulcerated and non-ulcerated regions. RNA extraction and DNA Microarray procedures were performed for each separate sample. (B) Scatter plot of gene expression values (log2 ratios of ulcerated vs. non-ulcerated regions) in two groups. The x-axis: rats that ingested a 0.85% NaCl solution alone, the y-axis: rats that ingested yeast TRX. The red and green spots respectively depict significantly higher and lower expressed genes in rats that ingested yeast TRX, compared to rats that ingested a 0.85% NaCl solution alone.

Table 1. Gene-annotation enrichment analysis based on the GO databases using differentially expressed genes between rats that ingested yeast TRX and rats that ingested a 0.85% NaCl solution alone.

Supplemental material

Supplemental Tables 1 and 2

Download PDF (126.2 KB)

Reprints and Corporate Permissions

Please note: Selecting permissions does not provide access to the full text of the article, please see our help page How do I view content?

To request a reprint or corporate permissions for this article, please click on the relevant link below:

Academic Permissions

Please note: Selecting permissions does not provide access to the full text of the article, please see our help page How do I view content?

Obtain permissions instantly via Rightslink by clicking on the button below:

If you are unable to obtain permissions via Rightslink, please complete and submit this Permissions form. For more information, please visit our Permissions help page.