1,276
Views
20
CrossRef citations to date
0
Altmetric
Food & Nutrition Science

A short-term ingestion of fructo-oligosaccharides increases immunoglobulin A and mucin concentrations in the rat cecum, but the effects are attenuated with the prolonged ingestion

, , , , , & show all
Pages 1592-1602 | Received 25 Mar 2014, Accepted 09 Apr 2014, Published online: 26 Jun 2014

Figures & data

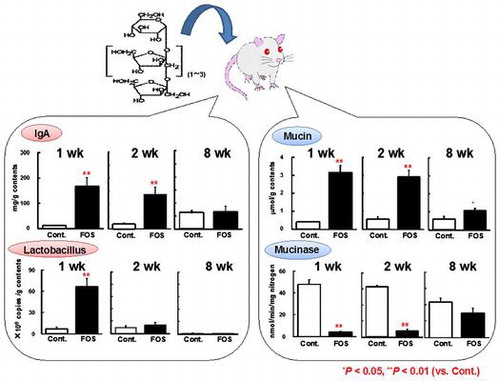
Table 1. Food intake, body weight gain, cecal variables including weights of tissue and contents, and pH in rats fed the control diet or a diet containing FOS at 60 g/kg diet for 1, 2, 4, or 8 wk (experiment 1).Table Footnotea

Table 2. Cecal organic acids and cecal numbers of lactobacilli and bifidobacteria in rats fed the control diet or a diet containing FOS at 60 g/kg diet for 1, 2, 4, or 8 wk (experiment 1).Table Footnotea

Fig. 1. PCR-DGGE analysis of cecal microbiota based on 16S rRNA gene sequences in rats fed the control diet or a diet containing FOS at 60 g/kg diet for 1, 2, 4, or 8 wk (expt 1).

Notes: (A) 1 and 2 wk, (B) 4 and 8 wk. Similarities among DGGE band profiles of cecal bacteria were calculated based on the position and intensity of bands, and the dendrogram of DGGE band profiles was constructed by the unweighted pair-group method with arithmetic mean (UPGMA) clustering method. Distances are measured in arbitrary units. C1–C8, samples from rats fed the control diet for 1, 2, 4, or 8 wk. F1–F8, samples from rats fed the FOS diet for 1, 2, 4, or 8 wk.

Fig. 1. PCR-DGGE analysis of cecal microbiota based on 16S rRNA gene sequences in rats fed the control diet or a diet containing FOS at 60 g/kg diet for 1, 2, 4, or 8 wk (expt 1).Notes: (A) 1 and 2 wk, (B) 4 and 8 wk. Similarities among DGGE band profiles of cecal bacteria were calculated based on the position and intensity of bands, and the dendrogram of DGGE band profiles was constructed by the unweighted pair-group method with arithmetic mean (UPGMA) clustering method. Distances are measured in arbitrary units. C1–C8, samples from rats fed the control diet for 1, 2, 4, or 8 wk. F1–F8, samples from rats fed the FOS diet for 1, 2, 4, or 8 wk.

Fig. 2. Cecal immunoglobulin A (IgA) concentrations (per g wet cecal contents) (A), the percentage of IgA plasma cells (B), and cecal mucin concentrations (per g wet cecal contents) (C) in rats fed the control diet or a diet containing FOS at 60 g/kg diet for 1, 2, 4, or 8 wk (expt 1).

Notes: Data are expressed as the mean ± SE, n = 6. Split plot design ANOVA was used to assess the effects of diet, time of exposure, and interactions between diet and time. Individual means at each time point were compared by Student-t test (*p < 0.05) or Welch’s-t test (#p < 0.05) to assess the effects of diet.

Fig. 2. Cecal immunoglobulin A (IgA) concentrations (per g wet cecal contents) (A), the percentage of IgA plasma cells (B), and cecal mucin concentrations (per g wet cecal contents) (C) in rats fed the control diet or a diet containing FOS at 60 g/kg diet for 1, 2, 4, or 8 wk (expt 1).Notes: Data are expressed as the mean ± SE, n = 6. Split plot design ANOVA was used to assess the effects of diet, time of exposure, and interactions between diet and time. Individual means at each time point were compared by Student-t test (*p < 0.05) or Welch’s-t test (#p < 0.05) to assess the effects of diet.

Table 3. Food intake, body weight gain, cecal variables including weights of tissue and contents, and ph in rats fed the control diet or a diet containing FOS at 60 g/kg Diet for 1, 2, 4, or 8 wk (experiment 2).Table Footnotea

Fig. 3. Cecal immunoglobulin A (IgA) concentrations (per g wet cecal contents) (A), the percentage of IgA plasma cells (B), and the gene expression of pIgR (relative value) (C) in rats fed the control diet or a diet containing FOS at 60 g/kg diet for 1, 2, or 8 wk (expt 2).

Notes: Data are expressed as the mean ± SE, n = 6. Split plot design ANOVA was used to assess the effects of diet, time of exposure, and interactions between diet and time. Individual means at each time point were compared by Student-t test (*p < 0.05) or Welch’s-t test (#p < 0.05) to assess the effects of diet.

Fig. 3. Cecal immunoglobulin A (IgA) concentrations (per g wet cecal contents) (A), the percentage of IgA plasma cells (B), and the gene expression of pIgR (relative value) (C) in rats fed the control diet or a diet containing FOS at 60 g/kg diet for 1, 2, or 8 wk (expt 2).Notes: Data are expressed as the mean ± SE, n = 6. Split plot design ANOVA was used to assess the effects of diet, time of exposure, and interactions between diet and time. Individual means at each time point were compared by Student-t test (*p < 0.05) or Welch’s-t test (#p < 0.05) to assess the effects of diet.

Fig. 4. Changes in immunoglobulin A (IgA) concentrations during the incubation of cecal contents (expt 2).

Notes: Cecal contents were incubated under nitrogen gas at 37 °C for up to 6 h. After incubation, IgA concentrations were determined and compared with values of 0 time incubation as 100%. Each point represented the mean ± SE, n = 6.

Fig. 4. Changes in immunoglobulin A (IgA) concentrations during the incubation of cecal contents (expt 2).Notes: Cecal contents were incubated under nitrogen gas at 37 °C for up to 6 h. After incubation, IgA concentrations were determined and compared with values of 0 time incubation as 100%. Each point represented the mean ± SE, n = 6.

Fig. 5. Cecal mucin concentrations (per g wet cecal contents) (A), the gene expression of Muc 2 (relative value) (B), and mucinase activities (per min per mg nitrogen) (C) in rats fed the control diet or a diet containing FOS at 60 g/kg diet for 1, 2, or 8 wk (expt 2).

Notes: Data are expressed as the mean ± SE, n = 6 except for those of mucinase activities (n = 12). Split plot design ANOVA was used to assess the effects of diet, time of exposure, and interactions between diet and time. Individual means at each time point were compared by Student-t test (*p < 0.05) to assess the effects of diet.

Fig. 5. Cecal mucin concentrations (per g wet cecal contents) (A), the gene expression of Muc 2 (relative value) (B), and mucinase activities (per min per mg nitrogen) (C) in rats fed the control diet or a diet containing FOS at 60 g/kg diet for 1, 2, or 8 wk (expt 2).Notes: Data are expressed as the mean ± SE, n = 6 except for those of mucinase activities (n = 12). Split plot design ANOVA was used to assess the effects of diet, time of exposure, and interactions between diet and time. Individual means at each time point were compared by Student-t test (*p < 0.05) to assess the effects of diet.

Reprints and Corporate Permissions

Please note: Selecting permissions does not provide access to the full text of the article, please see our help page How do I view content?

To request a reprint or corporate permissions for this article, please click on the relevant link below:

Academic Permissions

Please note: Selecting permissions does not provide access to the full text of the article, please see our help page How do I view content?

Obtain permissions instantly via Rightslink by clicking on the button below:

If you are unable to obtain permissions via Rightslink, please complete and submit this Permissions form. For more information, please visit our Permissions help page.