Figures & data
Fig. 1. The characteristic of diabetic rats induced by HFD and low-dose STZ.
Notes: Rats with T2DM (n = 42) were induced by HFD and low-dose STZ. After 1 week of STZ or vehicle injection, fasting blood glucose (A) and insulin (B) were checked, and HOMA-IR (fasting glucose × fasting insulin/22.5) was evaluated (C). All data are presented as means ± SE. Student’s t test was used to analyze the differences between two groups. A value of p < 0.05 was regarded as statistically significant. ##p < 0.01 vs. CON (n = 9).
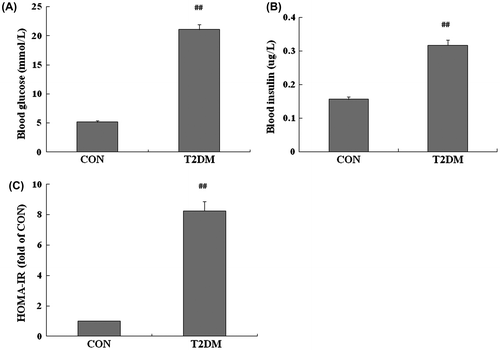
Fig. 2. Effects of PTF on insulin sensitivity of type 2 diabetic rats induced by HFD and low-dose STZ.
Notes: After treatment for 4 weeks, biochemical parameters including blood glucose (A) and insulin (B) were checked, insulin sensitivity was evaluated by HOMA-IR (C) and IPGTT (D). IPGTT: after an overnight fast, the rats were administered by intraperitoneal injection with glucose (2 g/kg). Blood glucose was measured at 0, 30, 60, and 120 min. AUC of IPGTT (E) were calculated for each parameter by the trapezoidal rule. All data are presented as means ± SE. The significance among multiple groups was analyzed by one-way analysis of variance. #p < 0.05, ##p < 0.01 vs. CON; *p < 0.05, **p < 0.01 vs. MOD.
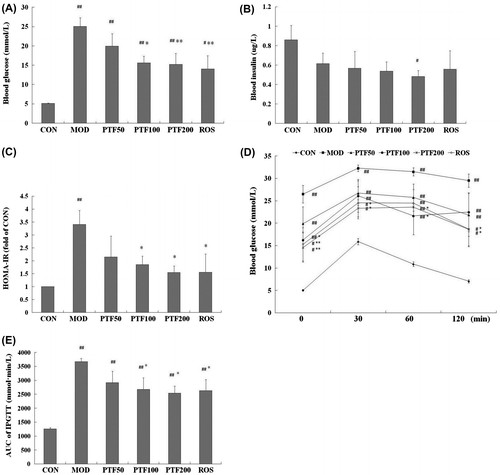
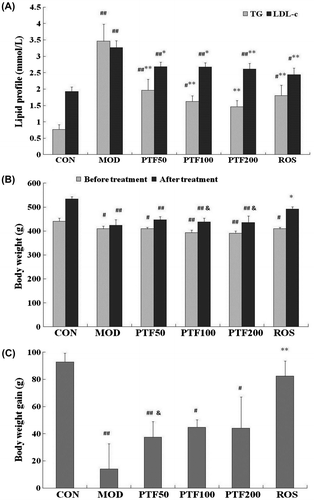
Fig. 3. Effects of PTF on blood lipid and body weight in type 2 diabetic rats.
Notes: (A) TG and LDL-c levels after treatment for 4 weeks. (B) Body weight before (after 2 weeks of STZ injection) and after treatment. (C) Body weight gain between before and after treatment. #p < 0.05, ##p < 0.01 vs. CON; *p < 0.05, **p < 0.01 vs. MOD; &p < 0.05 vs. ROS.