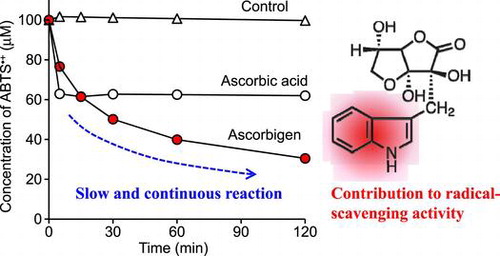
Figures & data
![](/cms/asset/b7d4fd6d-794d-4d25-a5e3-b0339ac61342/tbbb_a_932668_uf0001_oc.jpg)
Fig. 2. Time courses of DPPH radical (A)-, galvinoxyl radical (B)-, and ABTS•+ (C)-scavenging reactions of ascorbigen, ascorbic acid, and AA-2G.
), ascorbic acid (○), and AA-2G (![Fig. 2. Time courses of DPPH radical (A)-, galvinoxyl radical (B)-, and ABTS•+ (C)-scavenging reactions of ascorbigen, ascorbic acid, and AA-2G.Notes: Ascorbigen (Display full size), ascorbic acid (○), and AA-2G (Display full size) (each 20 μM) or control (∆) and DPPH radical (100 μM) were incubated at room temperature in 60% ethanol/40% citrate buffer (10 mM, pH 6). Ascorbigen, ascorbic acid, and AA-2G (each 2 μM) or control and galvinoxyl radical (10 μM) were incubated at room temperature in 60% ethanol/40% citrate buffer. A sample (20 μM) or control and ABTS•+ (100 μM) were incubated at room temperature in citrate buffer (50 mM, pH 6). Changes in the remaining radicals were measured at the indicated times. Each value is the mean ±SD of three separate experiments. Absence of the SD bar means that the SD bar is within the symbol.](/cms/asset/2b4be7b9-45e6-4b3a-8dd5-4ad53908f863/tbbb_a_932668_f0002_b.gif)
Fig. 3. HPLC chromatograms of the reaction product of ascorbigen with ABTS•+.
Notes: Ascorbigen (200 μM) and ABTS•+ (1.0 mM) were incubated in citrate buffer (50 mM, pH 6). At 30, 60, and 120 min, aliquots of the reaction mixture were withdrawn and analyzed by HPLC.
![Fig. 3. HPLC chromatograms of the reaction product of ascorbigen with ABTS•+.Notes: Ascorbigen (200 μM) and ABTS•+ (1.0 mM) were incubated in citrate buffer (50 mM, pH 6). At 30, 60, and 120 min, aliquots of the reaction mixture were withdrawn and analyzed by HPLC.](/cms/asset/1d7a7b09-9c27-4117-83a1-0b400b868a50/tbbb_a_932668_f0003_b.gif)
Fig. 4. Time courses of ABTS•+-scavenging reactions of ascorbigen, 3-methylindole, indole-3-aldehyde, and ascorbic acid.
), ascorbic acid (○), 3-methylindole (![Fig. 4. Time courses of ABTS•+-scavenging reactions of ascorbigen, 3-methylindole, indole-3-aldehyde, and ascorbic acid.Notes: Ascorbigen (Display full size), ascorbic acid (○), 3-methylindole (Display full size), and indole-3-aldehyde (□) (each 20 μM) or control (∆) and ABTS•+ (100 μM) were incubated at room temperature in 0.2% ethanol/citrate buffer (50 mM, pH 6). Changes in the remaining radicals were measured at the indicated times. Each value is the mean ±SD of three separate experiments. Absence of the SD bar means that the SD bar is within the symbol.](/cms/asset/a7ec47ba-6bd8-4d58-9c29-3e380fcbe4e6/tbbb_a_932668_f0004_b.gif)
Fig. 5. ORAC assay (A) and OxHLIA (B) for ascorbigen, ascorbic acid, AA-2G, and Trolox.
Notes: ORAC assay (A) reaction mixtures containing ascorbigen (
![Fig. 5. ORAC assay (A) and OxHLIA (B) for ascorbigen, ascorbic acid, AA-2G, and Trolox.Notes: ORAC assay (A) reaction mixtures containing ascorbigen (Display full size), ascorbic acid (○), AA-2G (Display full size), and Trolox (●) (each 10 μM) or control (∆), fluorescein (60 nM) and AAPH (18.75 mM) in 200 μL of phosphate buffer (75 mM, pH 7.4) were incubated at 37 °C for 90 min. Changes in fluorescence intensity of fluorescein were monitored. Each value is the mean ±SD of three separate experiments. Absence of the SD bar means that the SD bar is within the symbol. OxHLIA (B) reaction mixtures containing ascorbigen (Display full size), ascorbic acid (○), AA-2G (Display full size), and Trolox (●) (each 50 μM) or control (∆), sheep erythrocytes (0.7%, v/v) and AAPH (40 mM) in 200 μL of PBS were incubated at 37 °C for 280 min. Changes in remaining rate of erythrocytes were monitored. Each value is the mean ±SD of three separate experiments. Absence of the SD bar means that the SD bar is within the symbol.](/cms/asset/42a7d923-b6f8-4414-8f8b-a536faf82e37/tbbb_a_932668_f0005_b.gif)