Figures & data
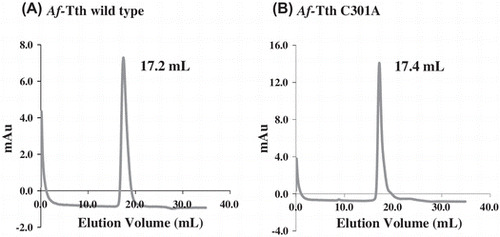
Fig. 1. Alignment of deduced amino acid sequence of 4THases.
Notes: Putative signal peptides are omitted in each sequence. Asterisks indicate conserved amino acid residues between the three 4THases, and colons and periods indicate strongly and weakly similar residues between the sequences, respectively. Cysteine residues are indicated in reverse. Af-Tth: 4THase from At. ferrooxidans; Ac-TetH: 4THase from At. caldus; and Aam-TTH: 4THase from Ad. ambivalens.
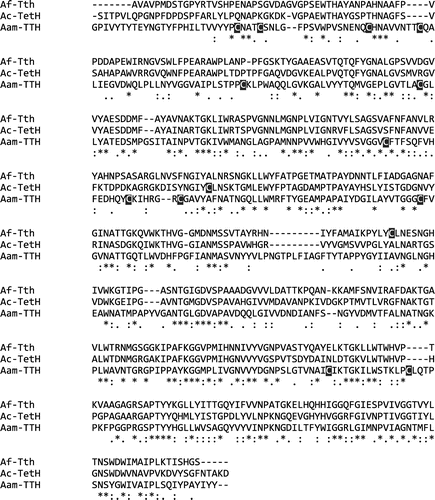
Fig. 2. SDS-PAGE of wild-type and mutant Af-Tth.
Notes: Lanes 1 and 2, soluble and insoluble fractions of E. coli BL21 Star™(DE3) harboring pET4TH or expression plasmid encoding C301A variant after induction by IPTG, respectively. Lane 3, the fraction of inclusion bodies after washing with Triton X-100. Lane 4, soluble recombinant proteins after refolding treatment. Bars A and B indicate wild-type and C301A variant, respectively. Lane M, molecular mass markers. Molecular masses (kDa) are indicated on the left of the panel.
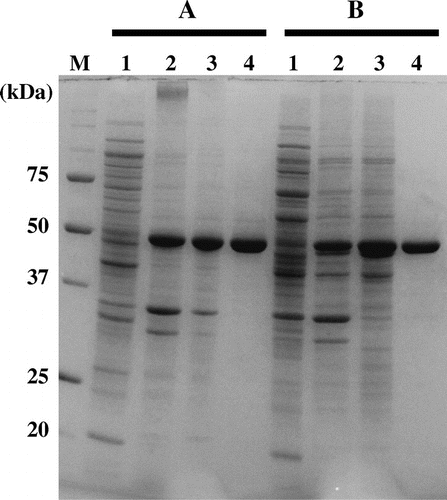
Fig. 3. Gel-filtration column chromatography of wild-type and mutant Af-Tth.
Notes: The refolded active Af-Tth wild-type (A) and C301A mutant (B) proteins were loaded onto TSKgel G3000SW chromatography columns. Elution volumes of peaks are indicated for each protein.
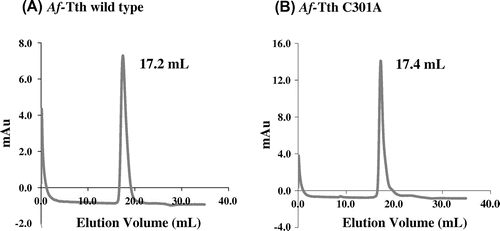
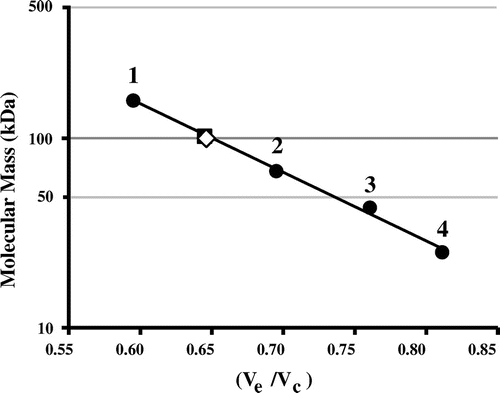
Fig. 4. Molecular mass determination of wild-type and mutant Af-Tth.
Notes: TSKgel G3000SW gel-filtration column was calibrated by using standard molecular mass markers (closed circle): 1, aldolase (158 kDa); 2, albumin (67 kDa); 3, ovalbumin (43 kDa); and 4, chymotrypsinogen (25 kDa). The molecular masses of Af-Tth wild-type (closed square) and C301A mutant (open diamond) proteins are determined to be 100 kDa. Ve and Vc represent elution volume of each protein and column volume, respectively.