935
Views
3
CrossRef citations to date
0
Altmetric
Microbiology & Fermentation Technology

Xylan-mediated aggregation of Lactobacillus brevis and its relationship with the surface properties and mucin-mediated aggregation of the bacteria

, , , , , & show all
Pages 2120-2127 | Received 07 May 2014, Accepted 10 Jul 2014, Published online: 18 Aug 2014

Figures & data

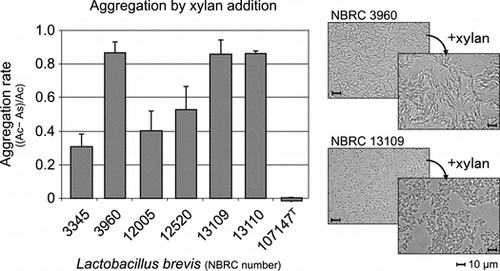
Fig. 1. Aggregation rates of L. brevis strains after the addition of xylan (A) and microscopic analysis of the strains in the presence (a, c) and absence (b, d) of xylan (B). The representative results by L. brevis strains NBRC 3960 (a, b) and NBRC 13109 (c, d) are shown as the results of optical microscopic analysis. As and Ac represent the optical density at 600 nm of the sample with xylan and the control without xylan, respectively. The soluble fraction of xylan was used, and data for 2 h after xylan addition are shown.
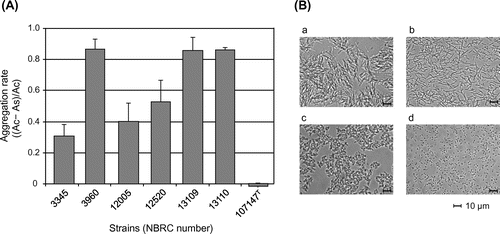
Fig. 1. Aggregation rates of L. brevis strains after the addition of xylan (A) and microscopic analysis of the strains in the presence (a, c) and absence (b, d) of xylan (B). The representative results by L. brevis strains NBRC 3960 (a, b) and NBRC 13109 (c, d) are shown as the results of optical microscopic analysis. As and Ac represent the optical density at 600 nm of the sample with xylan and the control without xylan, respectively. The soluble fraction of xylan was used, and data for 2 h after xylan addition are shown.

Fig. 2. Analysis of the cell surface proteins of L. brevis by SDS-PAGE. The numbers next to the bands denote the proteins subjected to identification.
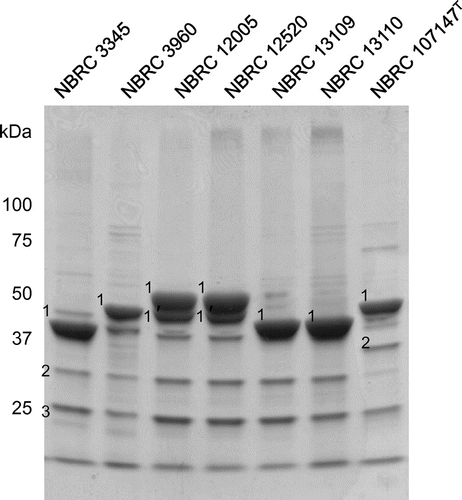
Fig. 2. Analysis of the cell surface proteins of L. brevis by SDS-PAGE. The numbers next to the bands denote the proteins subjected to identification.

Table 1. Identification of the cell surface proteins of L. brevis by MALDI-TOF mass spectrometry.

Fig. 3. Effect of LiCl treatment on the xylan-mediated aggregation rate and zeta potential of L. brevis. As and Ac represent the optical density at 600 nm of the sample with xylan and the control without xylan, respectively. The soluble fraction of xylan was used for the aggregation assay, and data for 2 h after xylan addition are shown. aThere was one outlier in aggregation rate of L. brevis NBRC 3960, which was treated with 4 M LiCl, and the value was −1.83 ± 0.58.
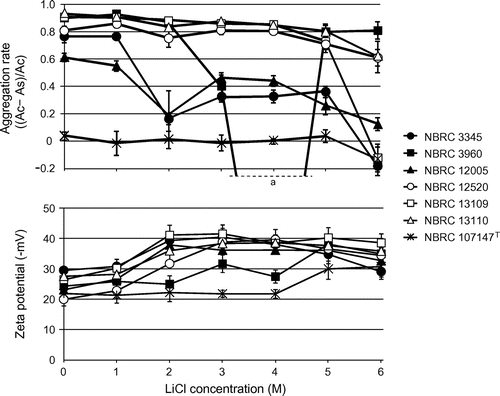
Fig. 3. Effect of LiCl treatment on the xylan-mediated aggregation rate and zeta potential of L. brevis. As and Ac represent the optical density at 600 nm of the sample with xylan and the control without xylan, respectively. The soluble fraction of xylan was used for the aggregation assay, and data for 2 h after xylan addition are shown. aThere was one outlier in aggregation rate of L. brevis NBRC 3960, which was treated with 4 M LiCl, and the value was −1.83 ± 0.58.

Fig. 4. Analysis of the remaining S-layer proteins of L. brevis after LiCl treatment. The bands corresponding to proteins labeled “1” in Figure are shown.
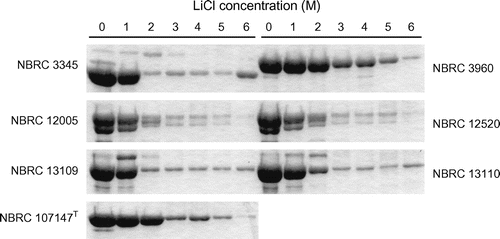
Fig. 4. Analysis of the remaining S-layer proteins of L. brevis after LiCl treatment. The bands corresponding to proteins labeled “1” in Figure 2 are shown.

Fig. 5. Effect of NaCl concentration on the xylan-mediated aggregation rate of both of intact and LiCl-treated L. brevis. As and Ac represent the optical density at 600 nm of the sample with xylan and the control without xylan, respectively. The soluble fraction of xylan was used for the aggregation assay, and data for 1 h after xylan addition are shown. aStandard assay condition contained 154 mM NaCl which came from saline solution. bThe concentration of LiCl treatment was 6 M for L. brevis NBRC 3960 and NBRC 107147T and 3 M for the other strains, respectively.
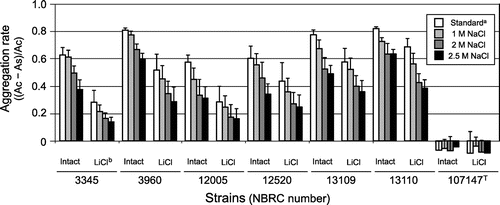
Fig. 5. Effect of NaCl concentration on the xylan-mediated aggregation rate of both of intact and LiCl-treated L. brevis. As and Ac represent the optical density at 600 nm of the sample with xylan and the control without xylan, respectively. The soluble fraction of xylan was used for the aggregation assay, and data for 1 h after xylan addition are shown. aStandard assay condition contained 154 mM NaCl which came from saline solution. bThe concentration of LiCl treatment was 6 M for L. brevis NBRC 3960 and NBRC 107147T and 3 M for the other strains, respectively.

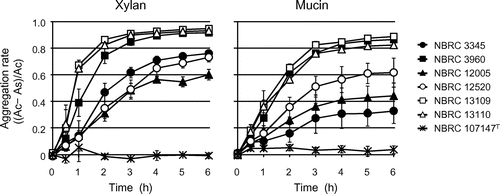
Fig. 6. Time course of the aggregation rate of L. brevis after xylan and mucin addition. As and Ac represent the optical density at 600 nm of the sample with xylan or mucin and the control without them, respectively. The soluble fractions of xylan and mucin were used.

Fig. 6. Time course of the aggregation rate of L. brevis after xylan and mucin addition. As and Ac represent the optical density at 600 nm of the sample with xylan or mucin and the control without them, respectively. The soluble fractions of xylan and mucin were used.

Reprints and Corporate Permissions

Please note: Selecting permissions does not provide access to the full text of the article, please see our help page How do I view content?

To request a reprint or corporate permissions for this article, please click on the relevant link below:

Academic Permissions

Please note: Selecting permissions does not provide access to the full text of the article, please see our help page How do I view content?

Obtain permissions instantly via Rightslink by clicking on the button below:

If you are unable to obtain permissions via Rightslink, please complete and submit this Permissions form. For more information, please visit our Permissions help page.