Figures & data
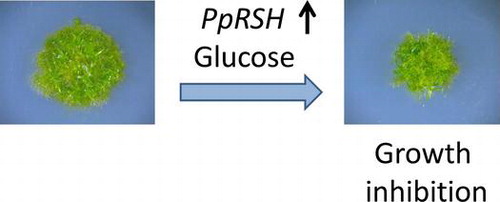
Fig. 1. Phylogenetic tree of RelA/SpoT homologs from flowering plants and P. patens.
Notes: Amino-acid sequences were aligned using Clustal W, and the phylogenetic tree was generated using Treeview software (http://txonomy.zoology.gla.ac.uk/rod/treeview.html). The analysis was performed with the following: AtRSH1, AtRSH2, AtRSH3, and AtCRSH (A. thaliana, NP_849287, NP_188021, NP_564652, and NP_188374, respectively); OsRSH1, OsRSH2, OsRSH3, OsCRSH1, OsCRSH2, and OsCRSH3 (O. sativa, NP_001050067, NP_001061969, AB095097, AB042936, AK058438, and AB298325, respectively); NtRSH1, NtRSH2, and NtRSH4 (N. tabacum, AB095098, AY346377, and AB095099, respectively); and PpRSH1a, PpRSH1b, PpRSH2a, PpRSH2b, PpRSH2c, PpRSH2d, PpRSH4, PpCRSH1a, and PpCRSH1b (P. patens, XP_001775664, XP_001775581, XP_001754945, XP_001785062, XP_001778487, XP_001778489, XP_001754946, XP_001753180, and XP_001774041, respectively).
Fig. 2. Expression analysis of PpRSHs.
Notes: The cDNA was prepared from the total RNA extracted from the protonema of P. patens grown on BCDATG agar for 3 days. The PCR was conducted using specific primer sets and the corresponding cDNA as the template. The PCR products were analyzed by gel electrophoresis and visualized by staining with ethidium bromide.
Fig. 3. Amino-acid sequence alignment of the previously reported RelA/SpoT homologs with PpRSH2a and PpRSH2b.
Notes: Amino-acid sequences were aligned using Clustal W. The arrow in the center shows the glycine residue that is essential for (p)ppGpp synthesis. The box indicates the HD box for metallophosphatases. The aligned sequences include PpRSH2a (P. patens, XP_001754945), PpRSH2b (P. patens, XP_001785062), AtRSH2 (A. thaliana, NP_188021), OsRSH2 (O. sativa, BAC81140), NtRSH2 (N. tabacum, AAQ23899), RelA (E. coli, AP_003350), and SpoT (E. coli, AP_004142).
Fig. 4. Complementation analysis of PpRSH2a and PpRSH2b in E. coli.
Notes: E. coli strains, CF1652 (λDE3, relA), W3110 (λDE3, wild-type), were transformed with pETRSH2a (encoding PpRSH2a), pETRSH2b (encoding PpRSH2b), or the empty vector (pET21d). Each transformed mutant was incubated on SMG agar medium in the presence or absence of 50 μM IPTG at 37 °C for 60 h.
Fig. 5. In vitro (p)ppGpp synthesis by recombinant PpRSH2a and PpRSH2b proteins.
Notes: Recombinant PpRSH2a and PpRSH2b proteins were prepared using a cell-free protein synthesis system. After reaction of PpRSH2a or PpRSH2b in the presence of 1 mM ATP (with 0.025 μCi/μL [γ-32P]ATP) and 1 mM GDP or GTP, a portion of the reaction mixture was applied to a PEI-cellulose TLC plate, which was developed with 1.5 M aqueous KH2PO4. The [32P]-labeled (p)ppGpp was visualized by autoradiography. A solution of cell-free protein synthesis system with empty pTD1 vector, which was applied to assay for (p)ppGpp synthetic activity, was used for control. The mixture of [32P]-labeled (p)ppGpp synthesized by pyrophosphate transferase of Streptomyces morookaensis was applied to same TLC as standard.
![Fig. 5. In vitro (p)ppGpp synthesis by recombinant PpRSH2a and PpRSH2b proteins.Notes: Recombinant PpRSH2a and PpRSH2b proteins were prepared using a cell-free protein synthesis system. After reaction of PpRSH2a or PpRSH2b in the presence of 1 mM ATP (with 0.025 μCi/μL [γ-32P]ATP) and 1 mM GDP or GTP, a portion of the reaction mixture was applied to a PEI-cellulose TLC plate, which was developed with 1.5 M aqueous KH2PO4. The [32P]-labeled (p)ppGpp was visualized by autoradiography. A solution of cell-free protein synthesis system with empty pTD1 vector, which was applied to assay for (p)ppGpp synthetic activity, was used for control. The mixture of [32P]-labeled (p)ppGpp synthesized by pyrophosphate transferase of Streptomyces morookaensis was applied to same TLC as standard.](/cms/asset/b12f27ce-f675-4e19-bd0d-c62f9374bc76/tbbb_a_952617_f0005_b.gif)
Fig. 6. Expression of PpRSH2a-GFP fusion protein or PpRSHb2-GFP fusion protein in the chloroplasts of P. patens protoplasts.
Notes: (A) Fluorography of PpRSH2a-GFP protein in a protoplast of P. patens. (B) Fluorography of PpRSH2b-GFP protein in a plotoplast of P. patens. Each RSH protein-GFP fusion construct was introduced into P. patens protoplasts by PEG-mediated transformation. Images were taken with a confocal laser-scanning microscope with excitation at 488 nm and emission at 530 nm for the detection of the GFP signal and an emission above 655 nm for the detection of autofluorescence from chlorophyll. Scale bar: 10 μm.
Fig. 7. Expression analysis of PpRSHs in P. patens.
Notes: The cDNA was prepared from the total RNA extracted from the protonema of P. patens grown on BCDATG agar with or without treatment of ABA, osmotic stress, UV irradiation, or dehydration. The PCR was conducted using each cDNA as the template. The PCR products were analyzed by gel electrophoresis and were visualized by staining with ethidium bromide.
Fig. 8. The phenotype of the P. patens mutants overexpressing PpRSH2a and PpRSH2b.
Notes: (a) The mutants and wild-type P. patens were grown at 25 °C on BCDAT agar supplemented with 1% glucose (w/v) for 20 days under continuous white fluorescent light. Scale bar: 5 mm. (b) Diameter of the each plant colony. Data are means ± SD (n = 6). Asterisks denote a significant difference between wild type (WT) and the mutants in a data pair (Student’s t-test, *p < 0.05, **p < 0.01).