Figures & data
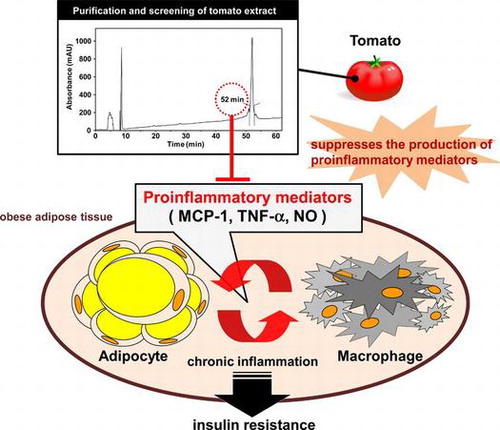
Fig. 1. Screening of tomato fraction in NO assay. (A) HPLC profile (276 nm) during fractionation of tomato extract. (B) NO production by RAW264 cells stimulated with LPS (5 μg/mL) and incubated with tomato fractions. (C) Viability of RAW264 cells stimulated with LPS (5 μg/mL) and incubated with tomato fractions. Data are presented as means ±SEM (n = 4–5). *p < 0.05 vs. culture treated with LPS alone.
Fig. 2. Purification of tomato fraction in HPLC. (A) HPLC profile (276 nm) during the fractionation of tomato extract. (B) NO production by RAW264 cells stimulated with LPS (5 μg/mL) and incubated with tomato fractions. (C) Viability of RAW264 cells stimulated with LPS (5 μg/mL) and incubated with tomato fractions. Data are presented as means ±SEM (n = 4–5). *p < 0.05 vs. culture treated with LPS alone.
Fig. 3. Effects of RF52 on secretion of inflammatory mediators by LPS-stimulated RAW264 macrophages.
Notes: RAW264 cells were stimulated with LPS (5 μg/mL) and incubated with RF52 for 24 h. The levels of MCP-1 (A), TNFα (B), and NO (C) in the culture medium were measured. Data are presented as means ±SEM (n = 4–5). **p < 0.01 vs. culture treated with LPS alone.
Fig. 4. Effects of RF52 on IκBα degradation and ERK phosphorylation in RAW264 macrophages stimulated with LPS.
Notes: RAW264 cells were stimulated with LPS (5 μg/mL) and incubated with RF52 for 1 h. Total cell lysates were extracted from cultured RAW264 cells. Western blotting was conducted using 50 μg of total cell lysate protein/lane, which was reacted with antibodies against (A) IκBα and β-actin, and (B) phosphorylated ERK1/2 and total ERK1/2 (upper band: ERK1, lower band: ERK2). Data are presented as means ±SEM of three replicate experiments. *p < 0.05 vs. culture treated with LPS alone.
Fig. 5. Effects of RF52 on inflammatory changes induced by coculture of 3T3-L1 adipocytes and RAW264 macrophages.
Notes: Differentiated 3T3-L1 adipocytes were cocultured with RAW264 macrophages (1 x 10⁵ cells/well) for 24 h. The levels of MCP-1 (A), TNFα (B), and NO (C) in the coculture medium were measured. Data are presented as means ±SEM (n = 4–5). **p < 0.01 vs. nontreated coculture.