Figures & data
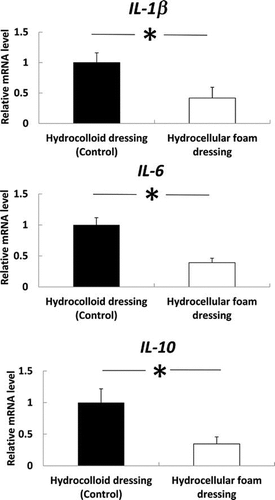
Fig. 1. Effects of HCF on water absorption.
Note: HCF absorbed significantly higher volume of water than HCD. Results are expressed as mean ± SE (n = 4). p < 0.05 indicates the significant difference between HCD and HCF.
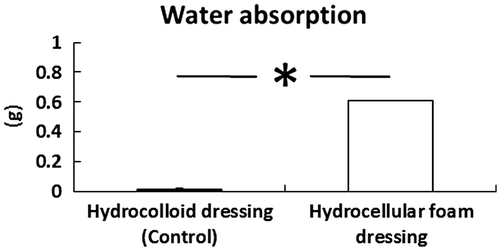
Fig. 2. Effects of HCF on wound healing in rat skin.
Note: Gross observations (A) and relative wound areas and (B) revealed increased wound contraction induced by HCF, compared with HCD. Results are expressed as mean ± SE (n = 3). *p < 0.05 indicates the significant difference between wounds covered by HCD and HCF.
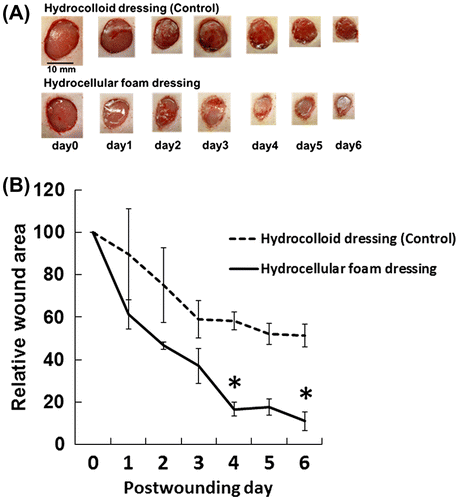
Fig. 3. Histologic analysis of the wound edge and the wound bed.
Note: Periwound skin and granulation tissue samples were collected on day 3 and used to assess histologic analysis. Hematoxylin and eosin staining showed severe inflammation and edema in the wound edge (A) and the wound bed (B) of the HCD group, compared with the HCF group. Magnification in (A) × 10, (B) × 20.
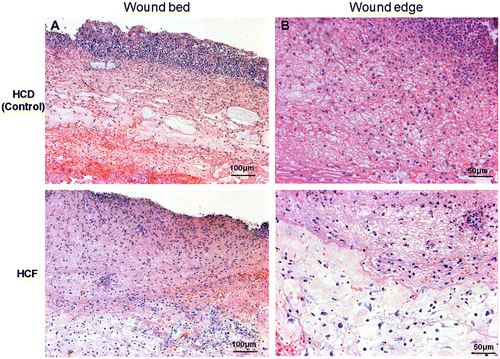
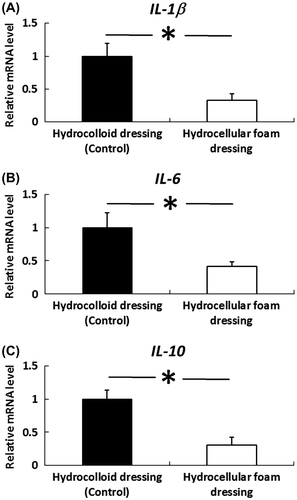
Fig. 4. Effects of HCF on the gene expression levels of IL-1β, IL-6 and IL-10 in the skin around the wound.
Note: Periwound skin samples were collected on day 3 and used to assess the gene-expression levels of IL-1β, IL-6, and IL-10. IL-1β, IL-6, and IL-10 mRNA levels in the periwound skin were measured by quantitative RT-PCR and expressed as values relative to GAPDH. Results are expressed as mean ± SE (n = 4). *p < 0.05 the indicates significant difference between HCD and HCF.

Fig. 5. Effects of HCF on the gene expression levels of IL-1β, IL-6, and IL-10 in the granulation tissue.
Note: Granulation tissue samples were collected on day 3 and used to assess the gene-expression levels of IL-1β, IL-6, and IL-10. IL-1β, IL-6, and IL-10 mRNA levels in granulation tissue were measured by quantitative RT-PCR and expressed as values relative to GAPDH. Results are expressed as mean ± SE (n = 4). *p < 0.05 indicates significant difference in rat granulation tissue between HCD and HCF.