Figures & data
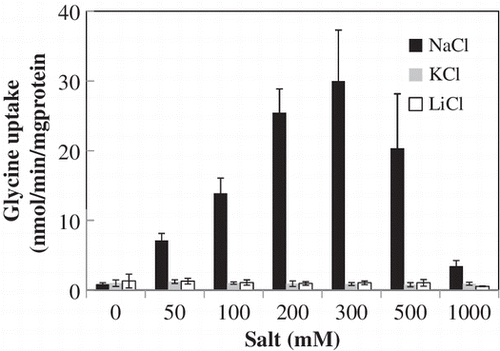
Fig. 1. Phylogenetic tree and TM topological model of AGCS family proteins.
Notes: (A) Phylogenetic tree of ApAgcS1, ApAgcS2, Acp from thermophilic bacterium PS3, Pseudomonas AgcS, and DagA from A. haloplanktis. The tree was constructed from alignments of full-length amino acid sequences using the Clustal W and TreeView programs. (B) TM topology model of ApAgcS1. TM topology model of ApAgcS1 was calculated by an algorithm TMHMM.
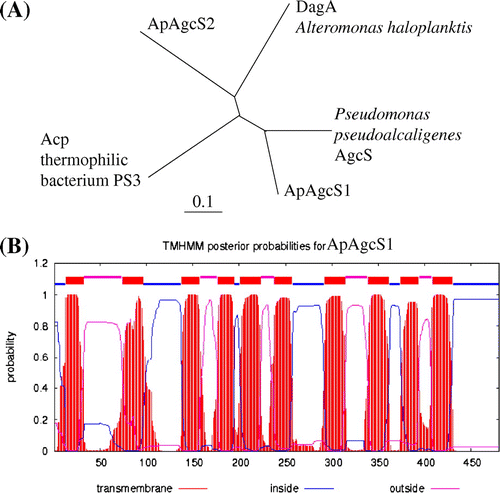
Fig. 2. Uptake of glycine by ApAgcS1.
Notes: (A) Time course of glycine uptake by ApAgcS1. B) Effects of NaCl, KCl, and LiCl on glycine uptake by ApAgcS1. ApAgcS1 expressing E. coli JW4166 cells were grown at 37 °C as described in “Materials and Methods.” Glycine uptake was measured after 10 μM [U-14C] glycine was added. In (B), duration of uptake was 1 min. Each value represents the average of three independent measurements and error bars represent standard deviations.
![Fig. 2. Uptake of glycine by ApAgcS1.Notes: (A) Time course of glycine uptake by ApAgcS1. B) Effects of NaCl, KCl, and LiCl on glycine uptake by ApAgcS1. ApAgcS1 expressing E. coli JW4166 cells were grown at 37 °C as described in “Materials and Methods.” Glycine uptake was measured after 10 μM [U-14C] glycine was added. In (B), duration of uptake was 1 min. Each value represents the average of three independent measurements and error bars represent standard deviations.](/cms/asset/86b49372-2247-407c-aea2-f6c3991d03ac/tbbb_a_968091_f0002_b.gif)
Fig. 3. Kinetics of glycine uptake by ApAgcS1.
Notes: (A) Saturation curve. (B) Effects of pH. Glycine uptake by ApAgcS1 in JW4166 cells was assayed in the presence of 0.3 M NaCl. The pH for saturation curve was 7.4. Duration of uptake was 1 min. Each value represents the average of three independent measurements and error bars represent standard deviations.
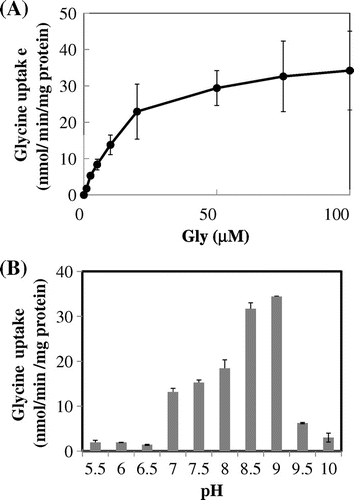
Fig. 4. Competition of glycine uptake by ApAgcS1.
Notes: The reaction mixtures contained 1 μM [U-14C]-glycine and 0.3 M NaCl. The concentration of various competitors was 100 μM. The value of uptake in the control (C) without a competitor is shown as 100%. Each value represents the average of three independent measurements and error bars represent standard deviations.
![Fig. 4. Competition of glycine uptake by ApAgcS1.Notes: The reaction mixtures contained 1 μM [U-14C]-glycine and 0.3 M NaCl. The concentration of various competitors was 100 μM. The value of uptake in the control (C) without a competitor is shown as 100%. Each value represents the average of three independent measurements and error bars represent standard deviations.](/cms/asset/e28162fe-809c-4cb6-a81a-39f814e90ef3/tbbb_a_968091_f0004_b.gif)
Fig. 5. Expression of mRNA for ApagcS1.
Notes: (A) Nitrate-deficient stress. (B) Salt stress (2.5 M NaCl). A. halophytica cells were collected after 0, 1, 3, 6, 12, and 24 h growth. RT-PCR analysis was performed as described in “Materials and Methods.” The ribonuclease P(rnpB) gene was used as the control. The values at time 0 for each gene were set to 1.0. Asterisk indicates significant difference (p < 0.05) from the values at time 0. Each value represents the average of three independent measurements and error bars represent standard deviations.
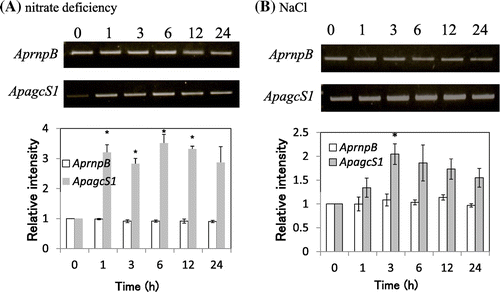
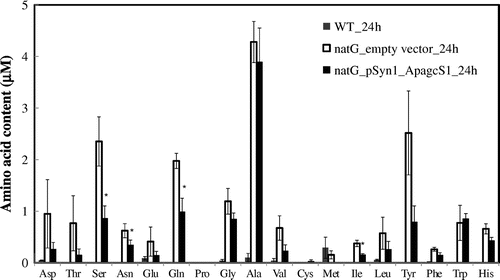
Fig. 6. Extracellular amino acid accumulation in the culture medium.
Notes: The extracellular amino acids in the growth medium after 24 h incubation of S. elongatus PCC 7942 were measured. Wild-type, gray bar; ΔnatG mutant harbored empty vector, black bar; ΔnatG mutant harbored ApagcS1, white bar. Asterisk indicates significant difference (p < 0.05) between S. elongatus PCC 7942 cells expressing natG_empty vector_24 h and natG_pSyn1_ApagcS1_24 h. Each value represents the average of three independent measurements and error bars represent standard deviations.
