Figures & data
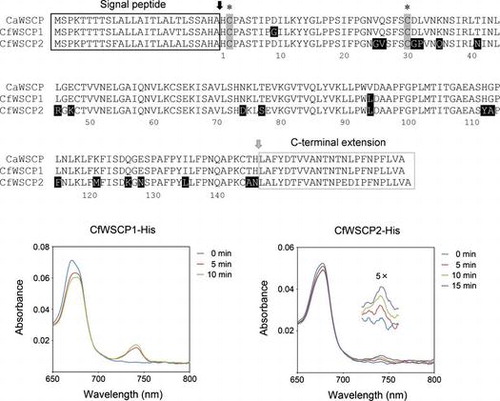
Fig. 1. Detection of native CfWSCP.
Notes: Absorption spectra (650–800 nm) of the partially purified fraction containing native CfWSCP. Blue and red lines represent before and after light irradiation treatment.
Fig. 2. Alignment of deduced amino acid sequences of CaWSCP, CfWSCP1, and CfWSCP2.
Notes: The alignment was generated by ClustalX. Black and gray arrows are post-translational cleavage sites for the signal peptide and C-terminal extension peptide, respectively. In mature regions, the amino acid residues highlighted by black background are different between CaWSCP and CfWSCPs. Asterisks indicate the cysteine residues that are essential for the Chl-binding ability of CaWSCP.
Fig. 3. Absorption spectra (650–800 nm) of reconstituted CfWSCP1-His (A), CfWSCP2-His (B), and control (C).
Fig. 4. Differential spectra of CfWSCPs.
Notes: (A) Differential spectrum of reconstituted CfWSCP1-His (spectrum after 5 min irradiation, minus spectrum before irradiation), (B) Differential spectrum of reconstituted CfWSCP2-His (spectrum after 15 min irradiation, minus spectrum before irradiation), and (C) Differential spectrum of control fraction (20 mM tris–HCl (pH 8.0)) (spectrum after 5 min irradiation, minus spectrum before irradiation).
Fig. 5. Differential spectra of CfWSCP1-His reconstituted with purified Chls.
Notes: (A) Differential spectrum of CfWSCP1-His reconstituted with Chl a (spectrum after 5 min irradiation, minus spectrum before irradiation), and (B) Differential spectrum of CfWSCP1-His reconstituted with Chl b (spectrum after 5 min irradiation, minus spectrum before irradiation). Measurements were performed in 20 mM tris–HCl buffer (pH 8.0) containing 10% methanol.