Figures & data
![](/cms/asset/c5406904-f3d5-4324-b61b-1183d1f08a81/tbbb_a_973365_uf0001_oc.jpg)
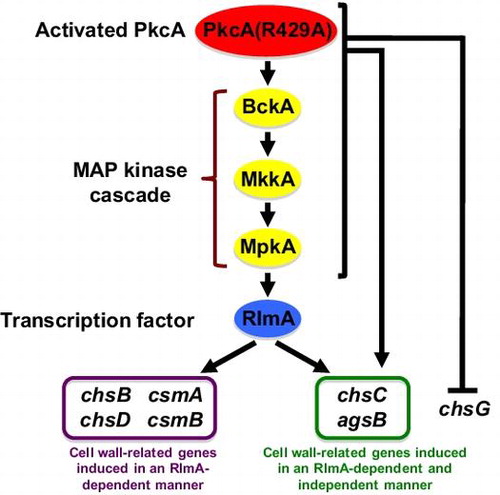
Table 1. A. nidulans strains used in this study.
Fig. 1. Characterization of R429A-1.
Notes: (A) Growth of R429A-1. 103 conidia of the wild-type strain (A1149) and R429A-1 were inoculated on MMG and MMTF, which are pkcA(R429A)-repressing and pkcA(R429A)-inducing conditions, respectively, and incubated for 72 h at 37 °C. (B) Conidiation efficiency of R429A-1. Conidia of the wild-type strain and R429A-1 were inoculated and incubated as described above, and the number of conidia was measured. Data are shown as means ± S.E.M. of three independent experiments. (C) Hyphal tip morphologies of the wild-type strain and R429A-1 incubated on MMTF for 72 h at 37 °C. Bars, 10 μm. (D, E) Phosphorylation levels of MpkA under the pkcA(R429A)-repressing (D) or pkcA(R429A)-inducing (E) condition. Cell extracts were prepared from the wild-type strain, alcA(p)-pkcA-3, and R429A-1, which were grown on MMG (D) or MMTF (E) for 20 h at 37 °C. The upper panels indicate the phosphorylated MpkA (ⓟ-MpkA) and the lower panels indicate the MpkA (MpkA). The numbers under the lower panels indicate the ratio of MpkA phosphorylation levels.
![Fig. 1. Characterization of R429A-1.Notes: (A) Growth of R429A-1. 103 conidia of the wild-type strain (A1149) and R429A-1 were inoculated on MMG and MMTF, which are pkcA(R429A)-repressing and pkcA(R429A)-inducing conditions, respectively, and incubated for 72 h at 37 °C. (B) Conidiation efficiency of R429A-1. Conidia of the wild-type strain and R429A-1 were inoculated and incubated as described above, and the number of conidia was measured. Data are shown as means ± S.E.M. of three independent experiments. (C) Hyphal tip morphologies of the wild-type strain and R429A-1 incubated on MMTF for 72 h at 37 °C. Bars, 10 μm. (D, E) Phosphorylation levels of MpkA under the pkcA(R429A)-repressing (D) or pkcA(R429A)-inducing (E) condition. Cell extracts were prepared from the wild-type strain, alcA(p)-pkcA-3, and R429A-1, which were grown on MMG (D) or MMTF (E) for 20 h at 37 °C. The upper panels indicate the phosphorylated MpkA (ⓟ-MpkA) and the lower panels indicate the MpkA (MpkA). The numbers under the lower panels indicate the ratio of MpkA phosphorylation levels.](/cms/asset/171a55f3-6776-4b95-9ebe-7f74ca80faba/tbbb_a_973365_f0001_b.gif)
Fig. 2. Sensitivity to cell wall-perturbing agents of R429A-1 under the pkcA(R429A)-inducing condition.
Notes: 103 conidia of the wild-type strain (A1149), alcA(p)-pkcA-3, and R429A-1 were inoculated on MMTF and MMTF containing calcofluor white (CFW), Congo red (CR), or micafungin, and incubated for 72 h at 37 °C.
![Fig. 2. Sensitivity to cell wall-perturbing agents of R429A-1 under the pkcA(R429A)-inducing condition.Notes: 103 conidia of the wild-type strain (A1149), alcA(p)-pkcA-3, and R429A-1 were inoculated on MMTF and MMTF containing calcofluor white (CFW), Congo red (CR), or micafungin, and incubated for 72 h at 37 °C.](/cms/asset/2ee99cfb-1d7a-4182-a7b9-ff26c0ce6336/tbbb_a_973365_f0002_b.gif)
Fig. 3. mRNA levels of the cell wall-related genes 1 h after shift to the pkcA(R429A)-inducing condition.
Notes: Total RNAs were prepared from the wild-type strain (A1149), R429A-1, ΔrlmA-1, and R429AΔrlmA-1, which were grown in MMG for 20 h at 37 °C and then were incubated in MMT for 1 h. The x-axes indicate the incubation time in MMT. The y-axes indicate the copy number of mRNA per 1 pg total RNA. Data are shown as means ± S.E.M. of three independent experiments. Statistical significance of data is given by the p-value (*p < 0.05).
![Fig. 3. mRNA levels of the cell wall-related genes 1 h after shift to the pkcA(R429A)-inducing condition.Notes: Total RNAs were prepared from the wild-type strain (A1149), R429A-1, ΔrlmA-1, and R429AΔrlmA-1, which were grown in MMG for 20 h at 37 °C and then were incubated in MMT for 1 h. The x-axes indicate the incubation time in MMT. The y-axes indicate the copy number of mRNA per 1 pg total RNA. Data are shown as means ± S.E.M. of three independent experiments. Statistical significance of data is given by the p-value (*p < 0.05).](/cms/asset/7479ce67-9926-4e97-9705-8d17034c29f5/tbbb_a_973365_f0003_b.gif)
Table 2. Sequences similar to the consensus Rlm1p binding sequence in the promoter regions of the cell wall-related genes of A. nidulans.
Fig. 4. Stress sensitivities of ΔrlmA-1 and R429AΔrlmA-1.
Notes: 103 conidia of the wild-type strain (A1149/pyroA), ΔrlmA-1, R429ApyroA-1, and R429AΔrlmA-1 were inoculated on MMG, MMTF, and MMG and MMTF containing calcofluor white (CFW), Congo red (CR), or micafungin, and incubated for 72 h at the indicated temperature.
![Fig. 4. Stress sensitivities of ΔrlmA-1 and R429AΔrlmA-1.Notes: 103 conidia of the wild-type strain (A1149/pyroA), ΔrlmA-1, R429ApyroA-1, and R429AΔrlmA-1 were inoculated on MMG, MMTF, and MMG and MMTF containing calcofluor white (CFW), Congo red (CR), or micafungin, and incubated for 72 h at the indicated temperature.](/cms/asset/b4a8c27d-91ad-480b-b09e-01c4c388a4f3/tbbb_a_973365_f0004_b.gif)
Fig. 5. mRNA levels of the cell wall-related genes under heat stress.
Notes: Total RNAs were prepared from the wild-type strain (A1149) and pkcA-ts-2, which were grown on MMG for 20 h at a permissive temperature (30 °C) and then incubated for the indicated time at a restriction temperature (42 °C). The x-axes indicate the incubation time at 42 °C. The y-axes indicate the relative mRNA levels to that of H2B (%). Data are shown as means ± S.E.M. of four independent experiments. Statistical significance of data relative to the result obtained at 0 h is given by the p-value (*p < 0.05).
![Fig. 5. mRNA levels of the cell wall-related genes under heat stress.Notes: Total RNAs were prepared from the wild-type strain (A1149) and pkcA-ts-2, which were grown on MMG for 20 h at a permissive temperature (30 °C) and then incubated for the indicated time at a restriction temperature (42 °C). The x-axes indicate the incubation time at 42 °C. The y-axes indicate the relative mRNA levels to that of H2B (%). Data are shown as means ± S.E.M. of four independent experiments. Statistical significance of data relative to the result obtained at 0 h is given by the p-value (*p < 0.05).](/cms/asset/41564821-6a6e-4d0f-bf2c-705002ffb44b/tbbb_a_973365_f0005_b.gif)
Fig. 6. A model of the signal transduction pathway that regulates the transcription of the cell wall-related genes under the pkcA(R429A)-inducing condition.
Notes: The signal transduction pathway suggested in this study is shown in this figure. Involvement of BckA, MkkA, and MpkA in the regulation of cell wall-related genes transcription is not investigated in this study and these genes are shown in parenthesis. Details are described in the text.
![Fig. 6. A model of the signal transduction pathway that regulates the transcription of the cell wall-related genes under the pkcA(R429A)-inducing condition.Notes: The signal transduction pathway suggested in this study is shown in this figure. Involvement of BckA, MkkA, and MpkA in the regulation of cell wall-related genes transcription is not investigated in this study and these genes are shown in parenthesis. Details are described in the text.](/cms/asset/64b5e5ab-1e7e-46af-bbc9-a3c2d201cbcc/tbbb_a_973365_f0006_b.gif)