Figures & data
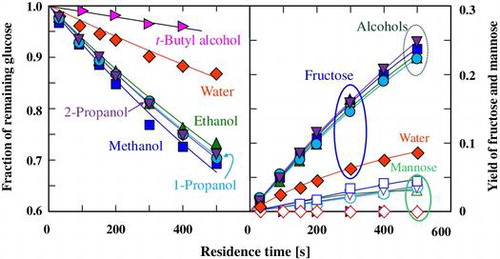
Fig. 1. Changes in the fraction of remaining glucose with residence time in (♢) subcritical water and 60% (v/v) subcritical aqueous alcohols ((□) methanol, (△) ethanol, (○) 1-propanol, (▽) 2-propanol, and (▷) t-butyl alcohol) at 180 °C.
Fig. 2. Yields of fructose and mannose derived from glucose at various residence times in subcritical water and in 60% (v/v) subcritical aqueous alcohols at 180 °C.
Note: Symbols are the same as those in Fig. , and the open and closed symbols represent the yields of fructose and mannose, respectively.
Fig. 3. Effects of the alcohol concentration on the selectivities of (♢) fructose and (□) mannose, (△) fraction of disappeared hexoses, and (○) yield of fructose for the treatment of glucose at 180 °C for 500 s.
Note: (a) Methanol, (b) 1-propanol, (c) 2-propanol.
Fig. 4. Changes in the fraction of remaining glucose with residence time at 180 °C in (♢) 80%, (□) 60%, (△) 40%, (○) 20%, and (▷) 0% (v/v) t-butyl alcohol and at (■) 200 °C in 60% (v/v) t-butyl alcohol.
Fig. 5. Yields of fructose derived from glucose at different residence times in subcritical aqueous t-butyl alcohol.
Note: The symbols are the same as those in Fig. .
Fig. 6. Effects of t-butyl alcohol concentrations on (♢) the selectivity of fructose, (△) the fraction of degraded hexoses, and (○) the yield of fructose for the treatment of glucose at 180 °C for 1000 s.