598
Views
4
CrossRef citations to date
0
Altmetric
Biochemistry & Molecular Biology (Notes)

Enhanced chondrogenesis with upregulation of PKR using a novel hydrostatic pressure bioreactor

, , &
Pages 239-241 | Received 19 Aug 2014, Accepted 26 Sep 2014, Published online: 28 Oct 2014

Figures & data

Fig. 1. The novel hydrostatic pressure bioreactor.

(a) Double package of monolayer sample filled up with culture medium and RO water, (b) schematic diagram of the bioreactor; Shimadzu Microservo device was utilized for compression loading onto the double-packed sample, (c) pressure measured during loading by the pressure sensor.
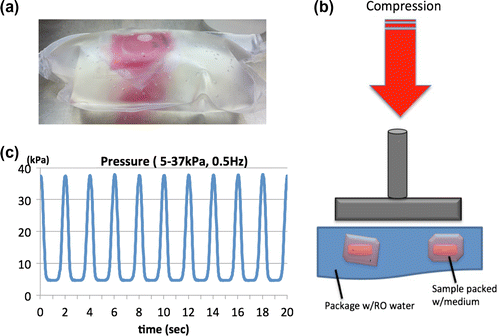
Fig. 1. The novel hydrostatic pressure bioreactor.(a) Double package of monolayer sample filled up with culture medium and RO water, (b) schematic diagram of the bioreactor; Shimadzu Microservo device was utilized for compression loading onto the double-packed sample, (c) pressure measured during loading by the pressure sensor.

Fig. 2. mRNA Expression of chondrogenic markers in ATDC5 cells under hydrostatic pressure measured by real-time PCR.

(a) Sox9 (b) Acan (c) Col2a1. Graphs show the fold change of chondrogenic markers mRNA expression relative to RPL13a mRNA normalized to the control mean. The bars represent the mean ± standard error. All the mRNA expressions of chondrogenic markers increased compared to control (n = 5) (p-value was obtained from student’s t-test).
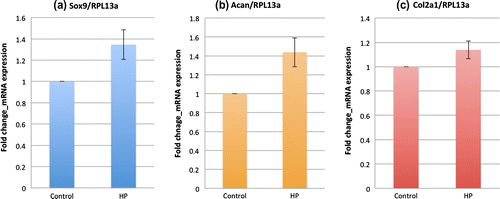
Fig. 2. mRNA Expression of chondrogenic markers in ATDC5 cells under hydrostatic pressure measured by real-time PCR.(a) Sox9 (b) Acan (c) Col2a1. Graphs show the fold change of chondrogenic markers mRNA expression relative to RPL13a mRNA normalized to the control mean. The bars represent the mean ± standard error. All the mRNA expressions of chondrogenic markers increased compared to control (n = 5) (p-value was obtained from student’s t-test).

Fig. 3. mRNA expression of PKR in ATDC5 cells under hydrostatic pressure measured by real-time PCR.

Graphs show the fold change of PKR-mRNA expression relative to RPL13a mRNA normalized to the control mean. The bars represent the mean ± standard error. mRNA expression of PKR increased compared to control (n = 5) (p-value was obtained student’s t-test).
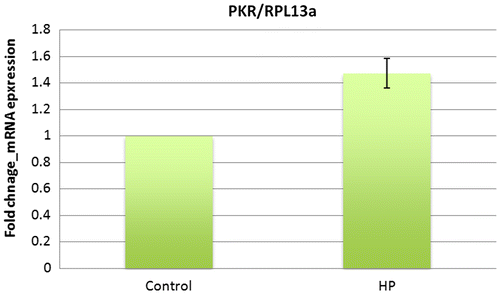
Fig. 3. mRNA expression of PKR in ATDC5 cells under hydrostatic pressure measured by real-time PCR.Graphs show the fold change of PKR-mRNA expression relative to RPL13a mRNA normalized to the control mean. The bars represent the mean ± standard error. mRNA expression of PKR increased compared to control (n = 5) (p-value was obtained student’s t-test).

Reprints and Corporate Permissions

Please note: Selecting permissions does not provide access to the full text of the article, please see our help page How do I view content?

To request a reprint or corporate permissions for this article, please click on the relevant link below:

Academic Permissions

Please note: Selecting permissions does not provide access to the full text of the article, please see our help page How do I view content?

Obtain permissions instantly via Rightslink by clicking on the button below:

If you are unable to obtain permissions via Rightslink, please complete and submit this Permissions form. For more information, please visit our Permissions help page.