944
Views
2
CrossRef citations to date
0
Altmetric
Biochemistry & Molecular Biology

Structural insights into stereospecific reduction of α, β-unsaturated carbonyl substrates by old yellow enzyme from Gluconobacter oxydans

, , , &
Pages 410-421 | Received 27 Aug 2014, Accepted 01 Oct 2014, Published online: 03 Jan 2015

Figures & data

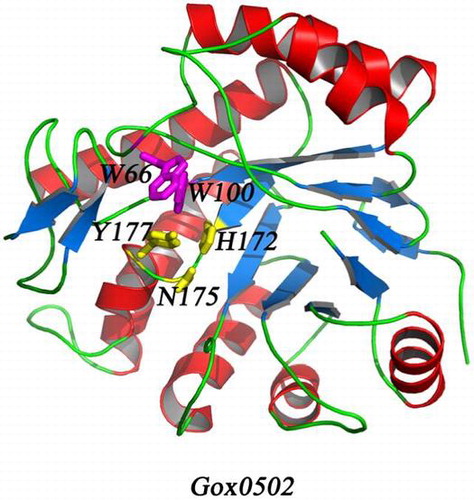
Table 1. X-ray data and refinement statistics.

Fig. 1. Crystal structure of Gox0502.

Notes: (A) Sequence alignment of Gox0502 with OYEs. Secondary structure elements are drawn on the basis of structures of Gox0502 and shown at the top of the aligned sequences. β-Sheets are shown as arrows in blue, whereas α-helices are shown as bars in red. Residues involved in enzyme catalysis are highlighted in green stars at the bottom of the aligned sequences, whereas the proposed key residues involved in substrate preference are highlighted in red triangle at the bottom of the aligned sequences. Gox0502, NCR, OYE1, OPR3, OPR1, and Gox2684 are the representations of Gluconobacter oxydans oxidoreductase 0502 (GI: 58038972), Z. mobilis ene reductase NCR (GI: 409107016), Saccharomyces cerevisiae OYE 1 (GI: 417431), Solanum lycopersicum 12-oxophytodienoate reductase 3 (GI: 350539279), Solanum lycopersicum 12-oxophytodienoate reductase 1 (GI: 350536879), and Gluconobacter oxydans oxidoreductase 2684 (GI: 58038436). (B) Stereoview of Gox0502.

Fig. 1. Crystal structure of Gox0502.Notes: (A) Sequence alignment of Gox0502 with OYEs. Secondary structure elements are drawn on the basis of structures of Gox0502 and shown at the top of the aligned sequences. β-Sheets are shown as arrows in blue, whereas α-helices are shown as bars in red. Residues involved in enzyme catalysis are highlighted in green stars at the bottom of the aligned sequences, whereas the proposed key residues involved in substrate preference are highlighted in red triangle at the bottom of the aligned sequences. Gox0502, NCR, OYE1, OPR3, OPR1, and Gox2684 are the representations of Gluconobacter oxydans oxidoreductase 0502 (GI: 58038972), Z. mobilis ene reductase NCR (GI: 409107016), Saccharomyces cerevisiae OYE 1 (GI: 417431), Solanum lycopersicum 12-oxophytodienoate reductase 3 (GI: 350539279), Solanum lycopersicum 12-oxophytodienoate reductase 1 (GI: 350536879), and Gluconobacter oxydans oxidoreductase 2684 (GI: 58038436). (B) Stereoview of Gox0502.

Fig. 2. Overall structure of Gox0502 and other OYEs.

Notes: (A) Overall structure of Gox0502. The conserved catalytic triad in Gox0502, H172-N175-Y177, is shown as sticks and colored in yellow, whereas the proposed key residues involved in substrate preference, W66-W100, are shown as sticks and colored in magenta. (B) Cartoon view of crystal structure of OYE1. OYE1 is colored in green. The conserved catalytic triad and the residues involved in substrate preference are shown as sticks and indicated. (C) Cartoon view of crystal structure of OPR3. OPR3 is colored in marine. The conserved catalytic triad and the residues involved in substrate preference are shown as sticks and indicated. (D) Cartoon view of crystal structure of OPR1. OPR1 is colored in yellow. The conserved catalytic triad and the residues involved in substrate preference are shown as sticks and indicated. (E) Cartoon view of crystal structure of NCR. NCR is colored in orange. The conserved catalytic triad and the residues involved in substrate preference are shown as sticks and indicated. The critical residues enhance the catalytic activities, P245-D337-F314, are shown as sticks and labeled in blue.

Fig. 2. Overall structure of Gox0502 and other OYEs.Notes: (A) Overall structure of Gox0502. The conserved catalytic triad in Gox0502, H172-N175-Y177, is shown as sticks and colored in yellow, whereas the proposed key residues involved in substrate preference, W66-W100, are shown as sticks and colored in magenta. (B) Cartoon view of crystal structure of OYE1. OYE1 is colored in green. The conserved catalytic triad and the residues involved in substrate preference are shown as sticks and indicated. (C) Cartoon view of crystal structure of OPR3. OPR3 is colored in marine. The conserved catalytic triad and the residues involved in substrate preference are shown as sticks and indicated. (D) Cartoon view of crystal structure of OPR1. OPR1 is colored in yellow. The conserved catalytic triad and the residues involved in substrate preference are shown as sticks and indicated. (E) Cartoon view of crystal structure of NCR. NCR is colored in orange. The conserved catalytic triad and the residues involved in substrate preference are shown as sticks and indicated. The critical residues enhance the catalytic activities, P245-D337-F314, are shown as sticks and labeled in blue.

Fig. 3. FMN-binding pocket of Gox0502 structure model.

Notes: (A) Cartoon view of Gox0502/FMN complex model. The conserved catalytic triad in Gox0502, H172-N175-Y177, is shown as sticks and colored in yellow, whereas the bound FMN is shown as sticks and colored based on element types. (B) Electrostatic potential surface view of (A). (C) Cartoon view of FMN-binding pocket of Gox0502 structure model. The residues involved in FMN binding are shown as sticks and colored by cyan, whereas the bound FMN is shown as sticks and colored in salmon. The potential cavity of substrate is indicated by red rectangle. (D) Electrostatic potential surface view of (C).

Fig. 3. FMN-binding pocket of Gox0502 structure model.Notes: (A) Cartoon view of Gox0502/FMN complex model. The conserved catalytic triad in Gox0502, H172-N175-Y177, is shown as sticks and colored in yellow, whereas the bound FMN is shown as sticks and colored based on element types. (B) Electrostatic potential surface view of (A). (C) Cartoon view of FMN-binding pocket of Gox0502 structure model. The residues involved in FMN binding are shown as sticks and colored by cyan, whereas the bound FMN is shown as sticks and colored in salmon. The potential cavity of substrate is indicated by red rectangle. (D) Electrostatic potential surface view of (C).

Table 2. Reductions of carvone by Wild-Type and Mutant G. oxydans OYEs.

Fig. 4. Substrate binding site of Gox0502 structure model.

Notes: (A) Cartoon view of substrate binding pocket of Gox0502/FMN/(R)-carvone model. The conserved catalytic triad and the residues involved in substrate preference are shown as sticks and colored in cyan. The bound FMN is shown as sticks and colored in salmon, whereas (R)-carvone is shown as sticks and colored in magenta. The mercury atom is shown as sphere and colored in yellow. (B) Electrostatic potential surface view of (A). (C) Cartoon view of substrate binding pocket of Gox0502/FMN/(S)-carvone model. The conserved catalytic triad and the residues involved in substrate preference are shown as sticks and colored in cyan. The bound FMN is shown as sticks and colored in salmon, whereas (S)-carvone is shown as sticks and colored in magenta. The mercury atom is shown as sphere and colored in yellow. (D) Electrostatic potential surface view of (C).

Fig. 4. Substrate binding site of Gox0502 structure model.Notes: (A) Cartoon view of substrate binding pocket of Gox0502/FMN/(R)-carvone model. The conserved catalytic triad and the residues involved in substrate preference are shown as sticks and colored in cyan. The bound FMN is shown as sticks and colored in salmon, whereas (R)-carvone is shown as sticks and colored in magenta. The mercury atom is shown as sphere and colored in yellow. (B) Electrostatic potential surface view of (A). (C) Cartoon view of substrate binding pocket of Gox0502/FMN/(S)-carvone model. The conserved catalytic triad and the residues involved in substrate preference are shown as sticks and colored in cyan. The bound FMN is shown as sticks and colored in salmon, whereas (S)-carvone is shown as sticks and colored in magenta. The mercury atom is shown as sphere and colored in yellow. (D) Electrostatic potential surface view of (C).

Fig. 5. Structural comparison of Gox0502 with OPR1 and Gox2684.

Notes: (A) Cartoon view of structural superposition of Gox0502 with OPR1. The conserved catalytic triad and the residues involved in substrate preference are shown as sticks and labeled in black/red for Gox0502/OPR1, respectively. (B) Electrostatic potential surface view of Gox0502. (C) Electrostatic potential surface view of OPR1. (D) Cartoon view of structural superposition of Gox0502 with Gox2684 model. The conserved catalytic triad is shown as sticks and labeled in black/red for Gox0502/Gox2684, respectively. (E) Cartoon view of FMN-binding pocket of Gox0502. The key residues R224 and S22 are shown as sticks and colored in cyan. (F) Cartoon view of FMN-binding pocket of Gox2684 model. The key residues R224 and A22 are shown as sticks and colored in cyan.

Fig. 5. Structural comparison of Gox0502 with OPR1 and Gox2684.Notes: (A) Cartoon view of structural superposition of Gox0502 with OPR1. The conserved catalytic triad and the residues involved in substrate preference are shown as sticks and labeled in black/red for Gox0502/OPR1, respectively. (B) Electrostatic potential surface view of Gox0502. (C) Electrostatic potential surface view of OPR1. (D) Cartoon view of structural superposition of Gox0502 with Gox2684 model. The conserved catalytic triad is shown as sticks and labeled in black/red for Gox0502/Gox2684, respectively. (E) Cartoon view of FMN-binding pocket of Gox0502. The key residues R224 and S22 are shown as sticks and colored in cyan. (F) Cartoon view of FMN-binding pocket of Gox2684 model. The key residues R224 and A22 are shown as sticks and colored in cyan.

Fig. 6. Structural comparison of Gox0502 with other OYEs.

Notes: (A) Cartoon view of structural superimposition of Gox0502, OPR1, OPR3, OYE1, and NCR. Gox0502, OPR1, OPR3, OYE1, and NCR are colored in blue, yellow, marine, green, and orange, respectively. The bound FMNs are shown as sticks. The conserved catalytic triad and the residues involved in substrate preference of Gox0502 are shown as sticks and indicated. (B) Electrostatic potential surface view of Gox0502. The bound FMN model is shown as sticks and colored based on element types.

Fig. 6. Structural comparison of Gox0502 with other OYEs.Notes: (A) Cartoon view of structural superimposition of Gox0502, OPR1, OPR3, OYE1, and NCR. Gox0502, OPR1, OPR3, OYE1, and NCR are colored in blue, yellow, marine, green, and orange, respectively. The bound FMNs are shown as sticks. The conserved catalytic triad and the residues involved in substrate preference of Gox0502 are shown as sticks and indicated. (B) Electrostatic potential surface view of Gox0502. The bound FMN model is shown as sticks and colored based on element types.
Supplemental material

Supplemental Materials

Download PDF (410.2 KB)

Reprints and Corporate Permissions

Please note: Selecting permissions does not provide access to the full text of the article, please see our help page How do I view content?

To request a reprint or corporate permissions for this article, please click on the relevant link below:

Academic Permissions

Please note: Selecting permissions does not provide access to the full text of the article, please see our help page How do I view content?

Obtain permissions instantly via Rightslink by clicking on the button below:

If you are unable to obtain permissions via Rightslink, please complete and submit this Permissions form. For more information, please visit our Permissions help page.