Figures & data
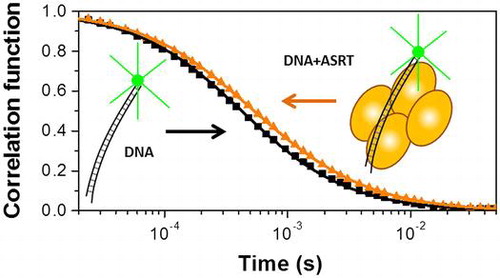
Table 1. DNA sequences.
Fig. 1. Normalized correlation functions of fluorescence-labeled DNA (R3).
Notes: (a) Correlation functions measured at different concentrations of ASRT (symbols) with the best fits to the data (solid lines). Inset: magnification of the middle region of the correlation functions. (b) Correlation functions measured with (red) and without (black) 100 μM BSA. Inset: magnification of the middle region of the correlation functions.
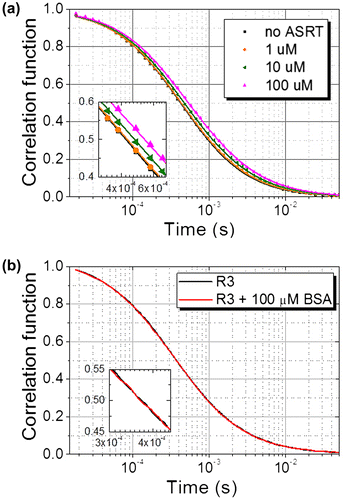
Fig. 2. The fraction bound obtained from the five different sequences listed in Table .
Notes: Filled box: Amp (sequence adapted from ampicillin gene), open circle: R3 (from pec promoter), open triangle: R2 (from pec promoter), filled diamond: PolyA (A tract), and cross: Rand20 (random sequence). Solid lines are the best fits to the Hill equation. Error bars are standard deviations from three independent sets of ASRT concentration-dependent FCS measurements.
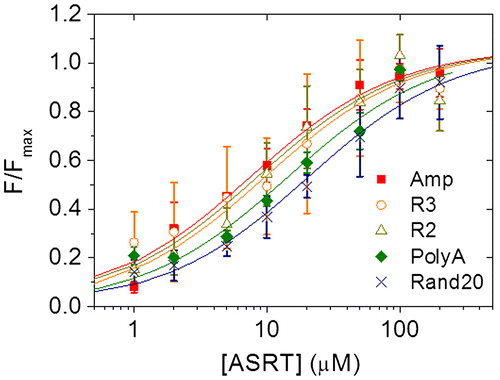
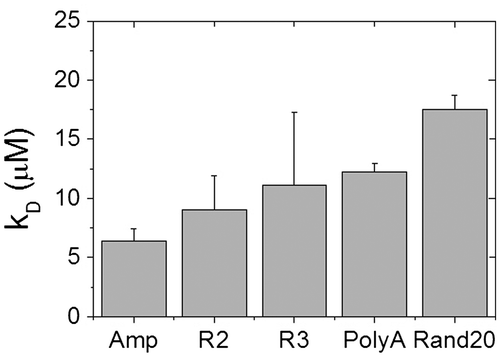
Fig. 3. The dissociation constant, KD, of ASRT on different DNA sequences.
Note: Error bars are standard errors from three independent sets of ASRT concentration-dependent FCS measurements.