Figures & data
Fig. 1. Purification of the S. amazonensis cytochrome c′ (SACP).
Notes: Lane 1, molecular mass markers; lane 2, total soluble extract of S. amazonensis cells; lane 3, DEAE batch elution with 0.15 M NaCl; lane 4, HiTrap Q linear gradient (0–0.3 M NaCl) elution with 0.15 M NaCl; lane 5, HiTrap SP linear gradient (0–0.3 M NaCl) elution with 0.15 M NaCl; and lane 6, Superdex 75 elution. One to ten micrograms of protein was loaded per lane, and the gel was stained with Coomassie Brilliant Blue G-250. The arrow indicates the position of the SACP protein.
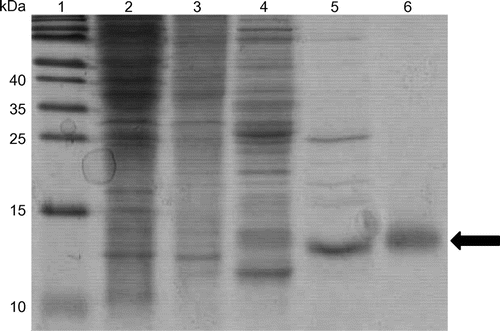
Fig. 2. Multiple sequence analysis of mature cytochrome c′ proteins.
Notes: The N-terminal sequence of the SACP protein was chemically determined up to the 5th residue in this study. Identical residues in the sequences of SACP, AVCP, or PHCP are boxed. Gaps in the alignment of the three sequences and α-helical regions of AVCP determined on its X-ray crystal structure analysis (PDB code: 1BBH) are indicated by dashes and underbars, respectively. Gly residues within the putative α-helical regions are highlighted by shadowing.
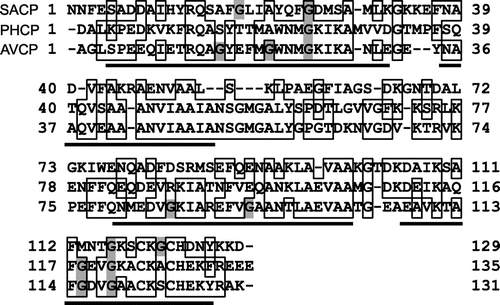
Fig. 3. Three-dimensional structure comparison.
Notes: The SACP model was built by homology modelling at the SWISS-MODEL workplace using the RGCP structure (PDB code: 1JAF) as the template. The simulated main chain structure of SACP is shown in black, and that of AVCP and its heme in gray. N- and C-termini are indicated by N and C, respectively. The relevant amino acid residues appeared in the text (Phe-17, Ala-21, and four Gly residues in the α-helices) are also indicated.
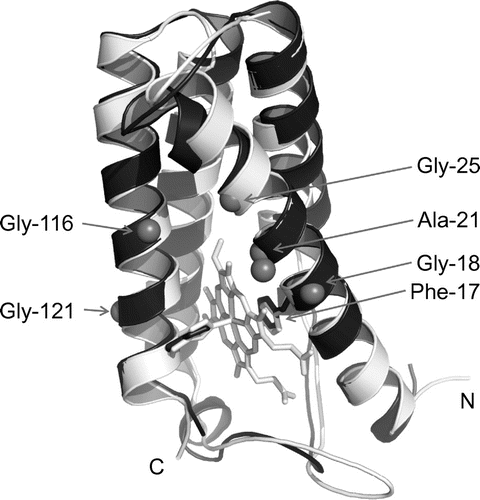
Fig. 4. Spectral analysis of the SACP protein.
Notes: (A) Visible absorption spectra. (B) CD spectrum. Black and gray solid lines represent the spectra of oxidized and reduced proteins, respectively. Specific wavelengths referred in the text are indicated by arrows in panels A and B.
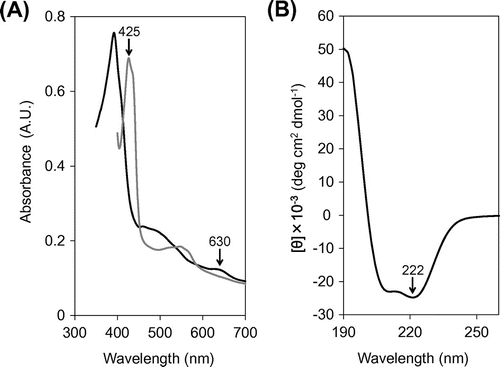
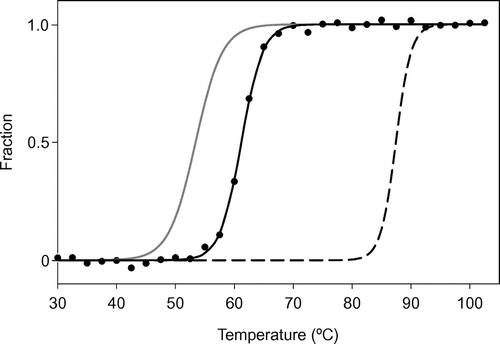
Fig. 5. Thermal denaturation of the SACP protein, as measured by CD.
Notes: Normalized raw data are shown by filled circles with a temperature interval of 2 °C. The fitting curve obtained from the SACP data with a temperature interval of 0.5 °C is shown as a solid black line. The fitting curves for AVCP (solid gray line) and PHCP (dashed black line) obtained under the same experimental conditions are redrawn based on the previous results.Citation3)