Figures & data
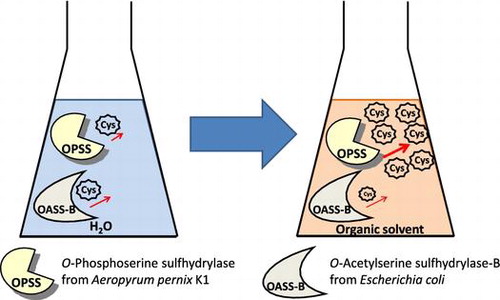
Fig. 1. Schematic representation of the proposed reaction catalyzed by OPSS.
Fig. 2. Purification of His-OASS-B.
Notes: Samples at various stages during the purification procedure were subjected to SDS–PAGE (the result of 12.5% polyacrylamide gel). Lane 1, molecular weight marker; Lane 2, crude cellular lysate supernatant; Lane 3, the fraction of wash buffer; Lane 4, the fraction after the cell lysate supernatant was passed through the column; Lane 5, the fraction of elution buffer.
Table 1. Comparison of histidine-tagged OASS-B (His-OASS-B) with other reported OASS-B.
Fig. 3. Thermal stability of OPSS (squares) and His-OASS-B (circles).
Notes: The enzymes were incubated for 1 h at temperatures from 0 to 100 °C for OPSS, and from 0 to 70 °C for His-OASS-B, respectively. The relative remaining activities were determined from the activity without incubation as 100. Results are expressed as the mean ± standard deviation from three replicates.
Fig. 4. The reactivity of OPSS and His-OASS-B in the presence of polar and aprotic solvent, such as (A) N, N′-dimethylformamide (DMF) and (B) 1,4-dioxane.
Notes: Filled squares and circles show the relative remaining activity of OPSS and His-OASS-B, respectively. The enzymes were incubated for 3 min at temperatures at 80 °C for OPSS and 30 °C for His-OASS-B in the solution containing the aprotic solvent by 0–50% (v/v). The relative activities were determined from the activity without organic solvent as 100. Results are expressed as the mean ± standard deviation from three replicates.
Table 2. Electrostatic interaction in OPSS.
Table 3. Electrostatic interaction in OASS-B from E. coli.
Fig. 5. Intramolecular electrostatic interaction of (A) OPSS (orange, PDB code 3vsa, and chain A) and (B) OASS-B (cyan, PDB code 2v03) and (C) superposition of (A) and (B).
Notes: Red line shows electrostatic interaction formed between amino acid residues shown in Tables and . Carbon, nitrogen, oxygen, and phosphorus atoms are shown as orange (OPSS) or cyan (OASS-B), blue, red, and pink balls, respectively. Illustration was created with MOE (ver.2011.10; Chemical Computing, Group, Montreal Canada).