Figures & data
Table 1. Plackett–Burman factorial design for screening significant parameters.
Fig. 1. Pareto chart for yield analysis: The size of the effects of each parameter is proportional to the height of the bar.
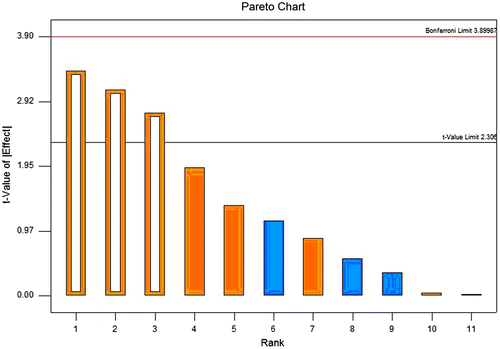
Table 2. ANOVA for DIPs yield.
Fig. 2. Effect of extraction parameters on yield of DIPs (extraction time, h; extraction temperature, ºC; ratio of water to raw material, mL/g).
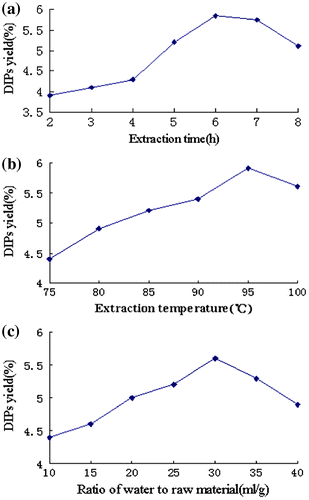
Table 3. Independent variables and their levels used in the response surface design.
Table 4. Box–Behnken design (coded) and results for extraction yield of DIP.
Table 5. Estimated regression model of relationship between response variable (yield of DIP) and independent variables (X1, X2, and X3).
Table 6. Analysis of variance for the fitted quadratic polynomial model of DIPs extraction.
Fig. 3. 3-D response surface plot and contour plot for DIPs yield as a function of extraction time and extraction temperature (X1: extraction time; X2: extraction temperature).
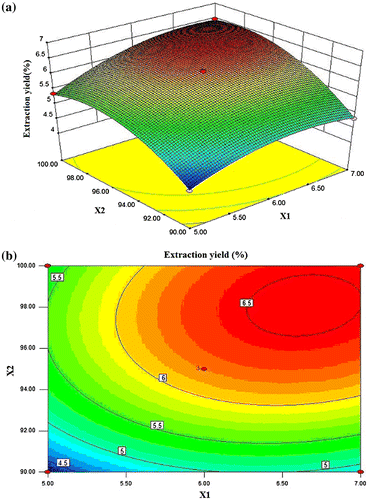
Fig. 4. 3-D response surface plot and contour plot for DIPs yield as a function of extraction time and ratio of water to raw material (X1: extraction time; X3: ratio of water to raw material).
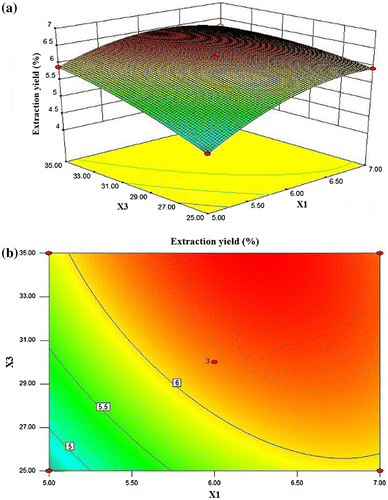
Fig. 5. 3-D response surface plot and contour plot for DIPs yield as a function of extraction temperature and ratio of water to raw material (X2: extraction temperature; X3: ratio of water to raw material).
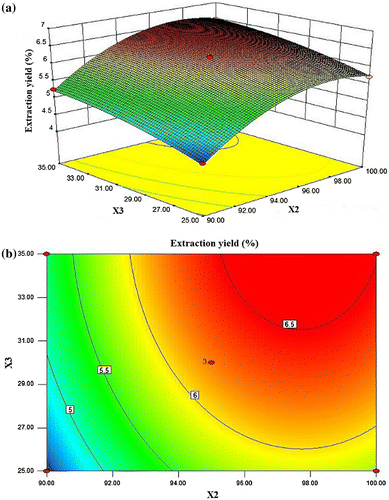
Fig. 6. Normal probability plot of the residuals.
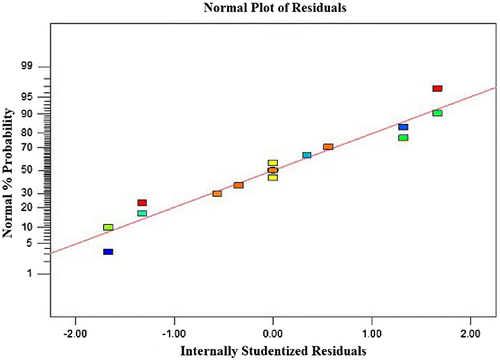
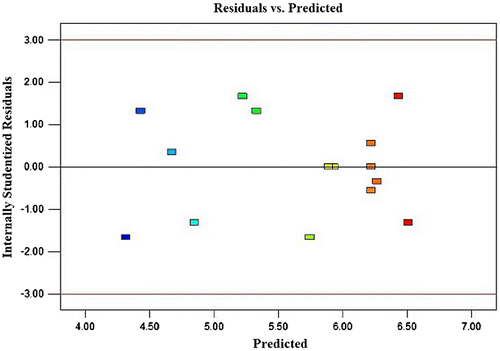
Fig. 7. Residuals vs. predicted values. The residuals scatter randomly at around ±1.5.