Figures & data
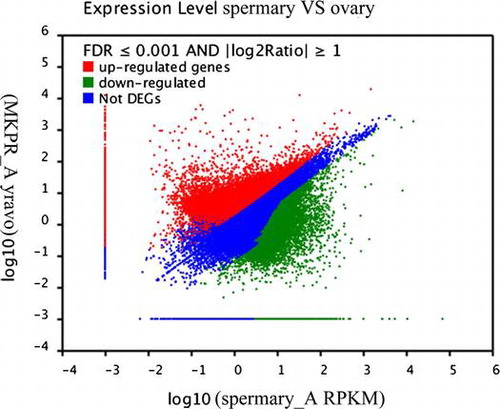
Table 1. Sequences of the primers used in this study.
Table 2. Overview of sequencing and assembly.
Fig. 1. Top Blast hits from the NCBI nr database.
Notes: Blast results against the NCBI nr database for all sequences with a cut-off E-value above 10–5 are shown.
Fig. 2. COG classification of unigenes.
Notes: Results were categorized into 25 function classes. Each function class is represented by different capital letters under the x-axis. The y-axis denotes the number of unigenes in a corresponding function class.
Fig. 3. GO classification of unigenes.
Notes: Unigenes were classified at the second level under three root GO domains: cellular component, molecular function, and biological process. The right and left y-axes indicate the number and corresponding percentage, respectively, of the ontology within each root domain. One unigene could be annotated within more than one GO term.
Fig. 4. Analysis of the DEGs between the ovary and spermary, including the 19,511 upregulated and 25,911 downregulated genes in the spermary.
Fig. 5. Expression analysis of 10 genes by real-time PCR.
Notes: The relative mRNA expression of ten genes was calculated using the 2-△△CT method, with β-actin as a reference gene. The data are presented as the mean relative expression ± standard deviation (SD) of four replicate real-time reactions from pooled tissue samples.