Figures & data
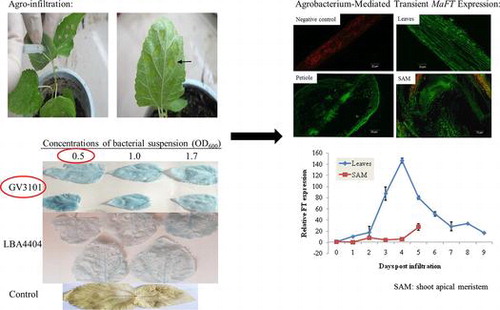
Fig. 1. Agro-infiltration was performed for mulberry seedling leaves.
Notes: (a) agro-infiltration performed on the lower leaf surface using a 1-mL syringe without needle; (b) multiple infiltrations conducted on a single leaf (arrows).
Fig. 2. Effects of Agrobacterium strains and concentrations of bacterial suspension (OD600: 0.5, 1.0, and 1.7) on GUS expression.
Notes: A. tumefaciens GV3101 and LBA4404 harboring pBE2133:GUS plasmid were infiltrated at the indicated concentrations. Leaves agro-infiltrated with water were shown as controls (bottom panel). GUS staining of the seedlings’ leaves was performed at 3 days post infiltration.
Fig. 3. Transient expression of MaFT:GFP was observed under inverted fluorescence microscope at 3 days post infiltration.
Notes: (a) No GFP fluorescence was observed in leaves infiltrated with A. tumefaciens GV3101 carrying pBE2133:GFP plasmid; (b)–(d) GFP fluorescence was detected in leaves infiltrated with A. tumefaciens GV3101 carrying pBE2133:GFP:MaFT plasmid and the GFP signals were observed in leaves (b), petiole (cross section) (c), and SAM (shoot apical meristem, (d)) of seedlings, respectively.
Fig. 4. Detection and quantification of GFP:MaFT by RT-PCR and quantitative RT-PCR (qRT-PCR) in mulberry.
Notes: (a) The mRNA expression of GFP:MaFT in leaves and SAM (lane 1: control; lane 2–3: leaves; lane 4–5: SAM); (b) the time-course MaFT:GFP mRNA expression was detected in leaves and SAM via quantitative RT-PCR.