Figures & data
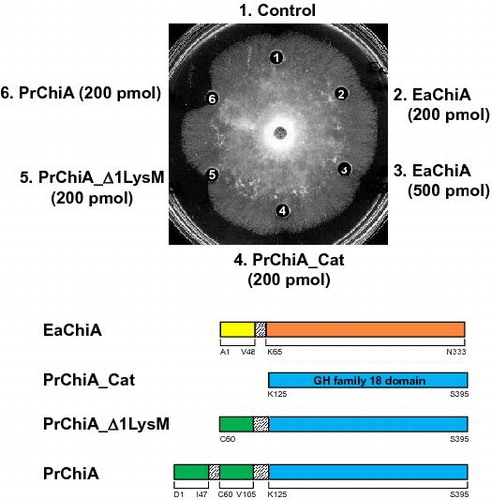
Fig. 1. Molecular mass of EaChiA from E. arvense.
Notes: SDS-PAGE was performed following the method of Laemmli. Lane 1, purified EaChiA from vegetative stems of E. arvense; lane 2, purified recombinant EaChiA. The gel was stained with Coomassie brilliant blue R250.
Table 1. Primers for PCR, RACE, and expression.
Fig. 2. Effect of pH and temperature on the chitinase activity and stability of the native and recombinant EaChiA.
Notes: (A) The effect of pH on chitinase activity was examined after incubation at 37 °C for 15 min. (B) The effect of pH on stability was examined by measuring residual activity after incubation at various pH at 37 °C for 24 h. (C) The effect of temperature on chitinase activity was examined after incubation for 15 min. (D) The effect of temperature on stability was examined by measuring residual activity after incubation in 0.1 M sodium phosphate buffer, pH 7.0, for 1 h. Methods are described in Materials and Methods. Closed and open circles indicate native and recombinant EaChiA, respectively.
Fig. 3. HPLC analysis of the hydrolysis products of (GlcNAc)n by EaChiA.
Notes: S, Standards (GlcNAc)1–6; (A) hydrolysis products of (GlcNAc)6; (B) hydrolysis products of (GlcNAc)5; (C) hydrolysis products of (GlcNAc)4. I to VI indicate (GlcNAc)1–6; α and β indicate the α- and β-anomer, respectively. Standard (GlcNAc)1–6 and the reaction mixtures were analyzed by HPLC on a TSKgel amide-80 column as described in Materials and Methods.
Fig. 4. Cloning strategy and primary structure of EaChiA.
Notes: (A) Cloning strategy for EaChiA cDNA. Three fragments were overlapped to obtain the complete nucleotide sequence of EaChiA cDNA. The open box represents the coding region and the solid lines represent the 5′- and 3′-noncoding regions. The relative position and direction of each primer are indicated by arrows. The solid lines indicate cDNA fragments amplified by each PCR. SP, signal peptide. (B). The nucleotide sequence of EaChiA cDNA with its deduced amino acid sequence. N-terminal amino acid sequences of native EaChiA and an internal peptide obtained by V8 protease digestion are underlined with dotted lines. The primers used for the cloning of EaChiA cDNA are shown by lines above their sequences. The putative signal peptide at the N-terminal is underlined. The putative poly(A) additional signal is underlined with a double line. (C) Schematic representation of EaChiA. GH indicates glycoside hydrolase.
Fig. 5. Alignment of amino acid sequences from domains of EaChiA with those from corresponding regions of several proteins.
Notes: (A) Alignment of sequences from LysM domains of EaChiA with those of LysM-containing proteins. (B) Alignment of the sequence from full length of EaChiA with that from PrChiA to TBC-1, which present a catalytic domain belonging to class IIIb chitinases. Identical residues are shown in white with a black background; dashes indicate gaps. An underline indicates the consensus region around the catalytic site in family-18 glycoside hydrolase. An arrow indicates an expected catalytic residue. PrChi-A 1st and 2nd indicate the first LysM domain and the second LysM domain, respectively, from the N-terminal of PrChiA. EaChiA, E. arvense chitinase-A (NCBI Accession # BAI22848); Mt-LysM, LysM domain-containing protein from M. thermophila (NCBI Accession # XP_003660096); Pa-LysM, LysM-containing protein from P. anserina (NCBI Accession # XP_001907459); Cb-LysM, LysM-containing protein from C. brenneri (NCBI Accession # EGT32879); TBC-1, plant class IIIb chitinase from Tulipa bakeri (NCBI Accession # BAA88408).
Fig. 6. Antifungal activity of EaChiA, PrChiA, and PrChiA mutants against T. viride.
Notes: Samples to be tested were placed in wells in 10 μL of distilled water. (1) blank (distilled water); (2) EaChiA (200 pmol); (3) EaChiA (500 pmol); (4) PrChiA_CatD (200 pmol); (5) PrChiA_Δ1LysM (200 pmol); (6) PrChiA (200 pmol).
Fig. 7. Elution profiles of EaChiA, PrChiA, and PrChiA mutants in affinity chromatography on a chitin column.
Notes: The proteins were applied to a chitin column equilibrated with 10 mM phosphate buffer, pH 7.0. After washing out the unadsorbed proteins with the same buffer, the adsorbed proteins were eluted successively with 1 M NaCl, 0.1, 1, and 5 acetate. (A) EaChiA; (B) PrChiA; (C) PrChiA_Δ1LysM; (D) PrChiA_CatD.