994
Views
8
CrossRef citations to date
0
Altmetric
Food & Nutrition Science

Fermented barley extract supplementation ameliorates metabolic state in stroke-prone spontaneously hypertensive rats

, , , , , , , , & show all
Pages 1876-1883 | Received 31 Mar 2015, Accepted 27 Apr 2015, Published online: 15 Jun 2015

Figures & data

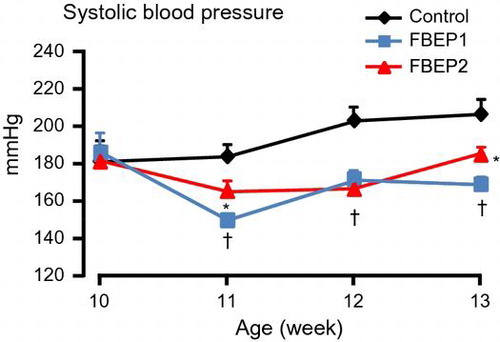
Table 1. Oligonucleotide sequences used for mRNA expression analysis.

Table 2. Effects of the chronic administration of FBEP on physiological and metabolic parameters in SHRSP.Table Footnotea

Table 3. Effects of chronic administration of FBEP on mRNA expression levels in the liver, measured by quantitative RT-PCR.Table Footnotea

Fig. 1. Effect of a single oral dose of FBEP (2 g/kg body weight) on systolic BP.

Notes: Values are expressed as mean ± SEM, n = 4; *p < 0.05; †p < 0.01 denote a significant difference when compared with the control group.

Fig. 1. Effect of a single oral dose of FBEP (2 g/kg body weight) on systolic BP.Notes: Values are expressed as mean ± SEM, n = 4; *p < 0.05; †p < 0.01 denote a significant difference when compared with the control group.

Fig. 2. Effects of chronic administration of FBEP on systolic BP (A), diastolic BP (B), and heart rates (C).

Notes: Values are expressed as a mean ± SEM, n = 6; *p < 0.05; †p < 0.01 denote a significant difference when compared with the control group.

Fig. 2. Effects of chronic administration of FBEP on systolic BP (A), diastolic BP (B), and heart rates (C).Notes: Values are expressed as a mean ± SEM, n = 6; *p < 0.05; †p < 0.01 denote a significant difference when compared with the control group.

Fig. 3. Changes in plasma glucose (A), iAUC glucose (B), plasma insulin (C), and iAUC insulin (D) based on the OGTT in rats.

Notes: Values are expressed as a mean ± SEM, n = 5–6; *p < 0.05 denotes a significant difference when compared with the control group.

Fig. 3. Changes in plasma glucose (A), iAUC glucose (B), plasma insulin (C), and iAUC insulin (D) based on the OGTT in rats.Notes: Values are expressed as a mean ± SEM, n = 5–6; *p < 0.05 denotes a significant difference when compared with the control group.

Fig. 4. Effect of FBEP on SOD (A) and CAT (B) activities and the level of 8-OHdG (C) in plasma of rats.

Notes: Values are expressed as a mean ± SEM, n = 5. Different letters represent significant differences (p < 0.05).

Fig. 4. Effect of FBEP on SOD (A) and CAT (B) activities and the level of 8-OHdG (C) in plasma of rats.Notes: Values are expressed as a mean ± SEM, n = 5. Different letters represent significant differences (p < 0.05).

Fig. 5. Effects of FBEP administration on Nrf2 by western blot analysis.

Notes: Each lane was loaded with 20 μg protein. Data have been normalized with lamin A/C. Values are expressed as mean ± SEM, n = 6; *p < 0.05 denotes a significant difference when compared with the control group.

Fig. 5. Effects of FBEP administration on Nrf2 by western blot analysis.Notes: Each lane was loaded with 20 μg protein. Data have been normalized with lamin A/C. Values are expressed as mean ± SEM, n = 6; *p < 0.05 denotes a significant difference when compared with the control group.

Reprints and Corporate Permissions

Please note: Selecting permissions does not provide access to the full text of the article, please see our help page How do I view content?

To request a reprint or corporate permissions for this article, please click on the relevant link below:

Academic Permissions

Please note: Selecting permissions does not provide access to the full text of the article, please see our help page How do I view content?

Obtain permissions instantly via Rightslink by clicking on the button below:

If you are unable to obtain permissions via Rightslink, please complete and submit this Permissions form. For more information, please visit our Permissions help page.