
Figures & data
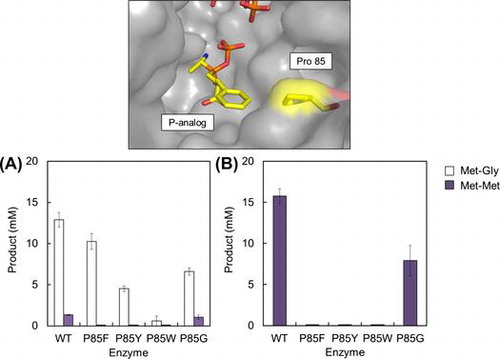
Fig. 1. Alignment of primary structures of Lals.
Notes: Amino acid conserved among the 5 sequences, BL00235 (GenBank AAU25674.1 from B. licheniformis), YwfE (CAB15798.1 from B. subtilis), TabS (BAJ15424.1 from P. syringae), Rsp1486a (BAG31900.1 from R. solanacearum), and RizA (BAG72134.1 from B. subtilis), is in white with black shading.
Fig. 2. Structure of Ywfe in complex with the phosphinate L-alanyl-L-phenylalanine analog (P-analog) Citation22) is superimposed onto the BL00235 crystal structure (PDB code, 3VOT).Citation21)
Notes: ADP, the P-analog, Phe83, and Pro85 residues are drawn with stick models with C atoms in yellow. Arrows indicate the position of Phe83 or Pro85. This figure was prepared using PyMol (http://www.pymol.org/).
Fig. 3. Synthesis of Met-Gly (white bars) and Met-Met (dark bars) by TabS and BL00235.
Notes: Reaction mixtures contained 20 mM Met and Gly as substrates. Data are averages from 3 independent experiments, and error bars indicate standard deviation of the means.
Fig. 4. Synthesis of Met-Gly (white bars) or Met-Met (dark bars) by the wild-type BL00235 or mutants.
Notes: Reaction mixtures contained 20 mM Met and Gly (A) or 40 mM Met (B) as substrates. Data are averages from three independent experiments, and error bars indicate standard deviation of the means.
Fig. 5. Kinetic analysis of Met-Gly-synthesizing reaction by the wild-type BL00235 or the P85F mutant.
Notes: (A) Linear relationship between the amount of Met-Gly formed and the concentration of each protein, (B–D) Plots of reaction velocity (V) vs. substrate concentration ([S]) curves (large shapes), and [S]/V vs. [S] curves (Hanes-Woolf plot; insets). The reactions were performed by varying the concentration of Met (B), Gly (C), or ATP (D). Data are averages from three independent experiments, and error bars indicate standard deviation of the means.Symbols: circle, the wild-type (WT) BL00235; triangle, the P85F mutant.
Fig. 6. Effect of substrate concentration on Met-Gly synthesis by the P85F mutant.
Notes: Reaction mixtures contained 20 mM Met and Gly (STD, white bar), 30–60 mM Met and 20 mM Gly (light gray bars), or 20 mM Met and 30–60 mM Gly (dark gray bars) as substrates. Data are averages from three independent experiments, and error bars indicate standard deviation of the means.
Supplemental material