Figures & data
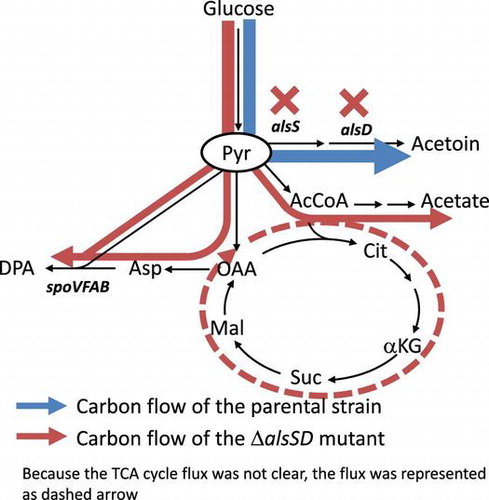
Fig. 1. Central carbon metabolic pathways with DPA biosynthetic pathways in B. subtilis.
Notes: G6P, glucose-6-phosphate; F6P, fructose-6-phosphate; FBP, fructose-1,6-bisphosphate; DHAP, dihydroxyacetone phosphate; 2PG, 2-phosphoglycerate; 3PG, 3-phosphoglycerate; PEP, phosphoenolpyruvate; Pyr, pyruvate; AcCoA, acetyl-CoA; Cit, citrate; αKG, α-ketoglutarate; Suc, succinate; Mal, malate; OAA, oxaloacetate; Glu, glutamate; Asp, aspartate; ASA, aspartate semialdehyde; Lys, lysine.
Table 1. Strains used in this study.
Table 2. Primer list for DPA-producing strain construction.
Fig. 2. Batch cultures of B. subtilis OA105 and OA105-ΔalsSD strains.
Notes: (A) OD600, (B) glucose concentration, (C) acetoin concentration and (D) acetate concentration; open circles, OA105; closed circles OA105-ΔalsSD. All cultures were performed in triplicate, and the average ± standard deviation is shown.
Table 3. Comparison of the specific rates between wild-type and ΔalsSD strains during the stationary phase.
Fig. 3. Batch cultures of B. subtilis OA105-DPA and OA105ΔalsSD-DPA strains.
Notes: (A) OD, (B) glucose concentration, (C) acetoin concentration and (D) acetate concentration (E) DPA concentration; Open circles, OA105-DPA; closed circles OA105ΔalsSD-DPA. All cultures were performed in triplicate, and average ± standard deviation is shown.
Table 4. Comparison of the specific rates of DPA production between wild-type and ΔalsSD strains during the stationary phase.
Fig. 4. Total carbon recovery of OA105-DPA and OA105ΔalsSD-DPA during the growth phase (GP) and the stationary phase (SP).
Notes: The evolved CO2 was present in the unidentified fraction.
Fig. 5. Concentrations of intracellular metabolite in the TCA cycle at the stationary phase in DPA-producing B. subtilis.
Notes: Intracellular pool sizes of metabolites in glycolysis (A) and the TCA cycle (B) are shown. Open and closed bars represent the intracellular pool sizes in OA105-DPA and OA105ΔalsSD-DPA, respectively. The average ± standard deviation of triplicate cultures is shown. nd. denotes not detected.