Figures & data
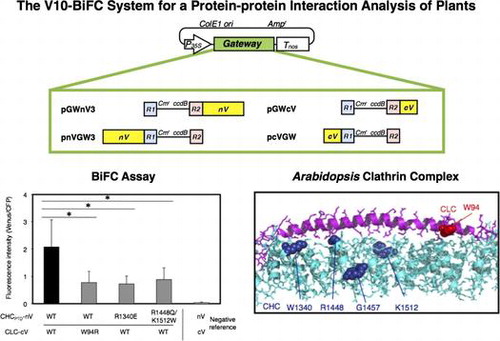
Fig. 1. Mapping probes used in a BiFC analysis, and immunoprecipitation analyses on the Arabidopsis CHC and CLC interaction.
Notes: Motifs predicted by Pfam are shown in the box. The amino acids used in the point mutation analysis are indicated by arrows. (A) A diagram of full-length CHC (At3g11130), including the terminal, linker, ankle, distal leg, knee, proximal leg, and trimerization domains as previously classified, is delineated.Citation17) Probes for full-length CHC and parts such as TD, LADD, HUB, and PTD were used in this study. (B) A diagram of full-length CLC (At2g40060) is delineated. The acidic residues EDD (amino acids at 5–7) are indicated by an arrowhead.Citation18,25) The predicted CHC-binding domain is shown in gray.Citation18) Probes for full-length CLC and parts such as F, M, and B were tested in this study.
Fig. 2. Schematic illustration of four plant Gateway-compatible BiFC vectors for transient expression.
Notes: Ampr, ampicillin resistance marker used for selection in bacteria; ccdB, negative selection marker used in bacteria; Cmr, chloramphenicol resistance marker used for selection in bacteria; ColE1 ori, ColE1 replication origin; cV, C-terminal region (211–239) of Venus; nV, N-terminal region (1–210) of Venus; P35S, 35S promoter; R1, attR1; R2, attR2; Tnos, nopaline synthase terminator.
Fig. 3. Interaction between CHCPTD and CLCM by a BiFC analysis.
Notes: (A) Visualization of the interaction between CHCPTD and CLCM by BiFC. Venus fluorescence images of leek epidermal cells expressing a pair of CHCPTD-nV and CLCM-cV with or without a competitor, or a pair of nV and cV as a negative reference were shown. Equal amounts of pUGW45 encoding ECFP were co-transformed in each cell as an internal reference. Bars show 20 μm. (B) Quantification of BiFC and evaluation of its specificity using a competitor. Non-fluorescence tagged CHCPTD by a 10-fold amount of BiFC-tagged CHCPTD used as a competitor. The resulting fluorescence intensity was calculated by dividing the fluorescence intensity from Venus by that from CFP (n = 15, error bars represent SD, **p < 0.001, t-test).
Fig. 4. Interaction between CHCPTD and CLC by a BiFC analysis.
Notes: (A) Visualization of the interaction of CHCPTD with full-length or a part of CLC by a BiFC analysis. Venus fluorescence images of leek epidermal cells expressing CHCPTD-nV together with CLC-cV, CLCF-cV, or CLCB-cV as well as CFP as an internal reference were shown. Bars show 20 μm. (B and C) Evaluation of the specificity of interaction of CHCPTD with CLC-cV or CLCF-cV using a competitive BiFC assay, respectively. (D) Evaluation of the interaction between CHCPTD and CLCB by a BiFC analysis. Non-fluorescence tagged CLC (B) or CLCF (C) was used as a competitor. The resulting fluorescence intensity was calculated as described in Fig. (n = 10–14, error bars represent SD, ***p < 0.001, **p < 0.01, t-test).
Fig. 5. Interaction of CLC with a part of CHC by a BiFC analysis.
Notes: The interaction of CLC with CHCTD (A), CHCLADD (B), or CHCHUB (C) was evaluated by a competitive BiFC assay. Non-fluorescence tagged CHCTD (A), CHCLADD (B), or CHCHUB (C) was used as a competitor. Plasmids encoding a pair of CLC-cV and a fragment of CHC-nV with or without a competitor, or a pair of nV and cV as a negative reference were bombarded on leek epidermal tissues. Equal amounts of a plasmid for CFP were also coated on bombarded particles as an internal reference. Quantification of the interaction between CHC and CLC and an evaluation of the specificity of this interaction was performed as described in Fig. (n = 10–15, error bars represent SD, **p < 0.0001, ***p < 0.005, t-test).
Fig. 6. Alignment of amino acid sequences of Arabidopsis CHCs and CLCs including point mutations in BiFC analyses.
Notes: (A) Alignment of the amino acid sequences of AtCHC-I (Arabidopsis thaliana, At3g08530), AtCHC-II (Arabidopsis thaliana, At3g11130), GmCHC (Glycine Max, AAC49294), CHC22-1 (Homo sapiens, NP_009029), BosCHC (Bos taurus, BTU31757), and mCtlc (Mus musculus, NM_001003908) using ClustalW2. Alignment of the mutated sequences of AtCHC-II such as R1340E, R1448 W, and K1512Q used in the BiFC analysis is indicated in white and boxed as I, II, and IV.Citation20,22) Glycine at 1557 of Arabidopsis CHC, indicated as III, was not used in the analysis because of the same amino acid as the substitution of K at 1443 to G of Bos taurus CHC.Citation22) (B) Alignment of the amino acid sequences of AtCLC-I (Arabidopsis thaliana, At2g20760), AtCLC-II (Arabidopsis thaliana, At2g40060), AtCLC-III (Arabidopsis thaliana, At3g51890), BosLCa (Bos taurus, X04851), and BosLCb (Bos taurus, X04853) using ClustalW2. The CHC-binding domain is shown by a line. Alignment of the mutated sequence of W94R for the BiFC analysis is in white and boxed. Positions corresponding to a pair of residues from bovine clathrin chains, shown by compensating mutations to interact with both chains, are boxed as I and V.Citation20) Positions corresponding to residues from CHC22-1, reported to not bind CLC, are boxed as II–IV.Citation22)
Fig. 7. Effects of the mutation of conserved amino acids on the interaction of CHCPTD and CLC by a BiFC analysis.
Notes: Effects of the mutation of conserved amino acids on the interaction of CHCPTD and CLC by a BiFC analysis. (A) A pair of plasmids encoding CLC-cV or CHC-nV with or without mutated amino acids excluding a pair of R1340E in CHCPTD and W94R in CLC, or a pair of plasmids for nV and cV as a negative reference were bombarded on leek epidermal tissues. (B) A pair of plasmids encoding CLC-cV or CHC-nV or of those encoding CHCPTD-R1340E-nV and CLC-W94R-cV were co-bombarded. Equal amounts of a plasmid for CFP were also coated on bombarded particles as an internal reference. The resulting fluorescence intensity was calculated as described in Fig. (n = 10–14, error bars represent SD, *p < 0.003, t-test).
Fig. 8. The 3D structure of the CHC–CLC complex of Bos taurus and that of the predicted orthologous complex of Arabidopsis thaliana.
Notes: (A) Structures of the interface between CLC and the carboxyl terminal of CHC. (B) Detailed structures of the complex with the amino acids mutated in this study. The mutated amino acids in CHC and CLC in PPI analyses are shown in purple and red, respectively.