Figures & data
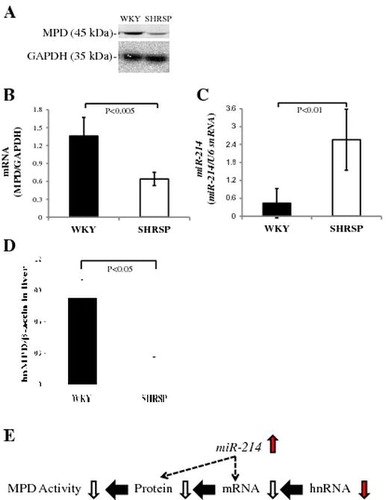
Fig. 1. The 3′-untranslated region of MPD mRNA and binding site of miR-214.
Notes: A: The 3′-untranslated region (3′-UTR) of MPD mRNA. uga is the stop codon of MPD mRNA. B: Binding site between the 3′-UTR of MPD mRNA and miR-214. * shows the binding site.
Fig. 2. MPD mRNA and protein levels in cells transfected with mmu-miR-214-3p.
Notes: A: Uptake of mmu-miR-214-3p by lipofection. Real-time PCR was performed using primer pairs for miR-214 or U6 snRNA from total RNA containing miR in NRK cells transfected with mmu-miR-214-3p and non-treated cells (non-treatment: control). Relative miR-214 levels were quantified using U6 snRNA as an internal control. Values are the means for two independent experiments. B: MPD mRNA levels in NRK cells transfected with mmu-miR-214-3p or non-target RNA and non-treated cells. Real-time PCR was performed using primer pairs for MPD or GAPDH from total RNA containing miR in NRK cells transfected with mmu-miR-214-3p or non-target RNA and non-treated cells (control). Relative MPD levels were quantified using GAPDH as an internal control. Values are the means ± SD of four independent experiments. C: MPD protein levels in NRK cells transfected with mmu-miR-214-3p or non-target RNA and non-treated cells. Samples (15 μg) for NRK cells transfected with mmu-miR-214-3p or non-target RNA and non-treated cells (control) were subjected to SDS-PAGE followed by immunoblot analysis. Bands of MPD were quantified using the Intelligent Quantifier. Relative MPD protein levels were quantified using GAPDH as an internal control. Values are the means ± SD of four independent experiments.
Fig. 3. miR-214 directly bound to the 3′-UTR of MPD in the rat.
Notes: PGV-B2 (containing putative miR-214 matching sites downstream of the luciferase coding region) with mmu-miR-214-3p or non-target RNA and pSV (containing the β-galactosidase gene) were co-transfected. Luciferase and β-galactosidase activities were measured as described in the Materials and Methods. The efficiency of the uptake of PGV-B2 was adjusted for by β-galactosidase activity in pSV. Values are the means ± SD of four independent experiments.
Fig. 4. Total cholesterol levels and cholesterol levels of HDL and VLDL/LDL in serum samples from WKY and SHRSP.
Notes: Total cholesterol levels (A) and the cholesterol levels of HDL (HDL-C: B) and VLDL/LDL (VLDL/LDL-C: C) were measured in serum samples as described in the Materials and Methods. Values are the means ± SD of four independent experiments.
Fig. 5. Cholesterol levels in liver of WKY and SHRSP.
Notes: Cholesterol levels in the liver were measured as described in Materials and Methods. Values are the means ± SD of four independent experiments.
Fig. 6. MPD protein and mRNA levels in WKY and SHRSP livers.
Notes: A: Samples (15 μg) from the livers of WKY and SHRSP were subjected to SDS-PAGE followed by immunoblot analysis. B: Bands of MPD and GAPDH from the liver (A) were quantified using the Intelligent Quantifier. C: Real-time PCR was performed using primer pairs for MPD or GAPDH from total RNA in the livers of WKY and SHRSP. Relative protein (B) and mRNA (C) levels of MPD were quantified using GAPDH as an internal control. D: Real-time PCR was performed using primer pairs for miR-214 or U6 snRNA from total RNA containing miR in the livers of WKY and SHRSP. Relative miR-214 levels were quantified using U6 snRNA as an internal control. Values are the means ± SD of four independent experiments.
Table 1. miR combined with the 3′-UTR of cholesterol biosynthetic enzyme mRNA (Target mRNA) in rats.
Fig. 7. HMG-CoAS, SQS, and PTEN mRNA levels in WKY and SHRSP livers.
Notes: Real-time PCR was performed using primer pairs for HMG-CoAS, SQS, PTEN, or GAPDH from total RNA in the livers of WKY and SHRSP. Relative mRNA levels of HMG-CoAS, SQS, or PTEN were quantified using GAPDH as an internal control. Values are the means ± SD of four independent experiments.
Fig. 8. Exon and intron regions of β-actin and MPD.
Notes: Exon (under line) and intron regions in the DNA of β-actin (A) or MPD (B), respectively. Primer pairs (italic type) were designed from the sites of the exon and intron in the DNA of β-actin or MPD, respectively.
Fig. 9. MPD hnRNA levels in WKY and SHRSP livers.
Notes: Real-time PCR was performed using primer pairs (Fig. ) for MPD or β-actin from total RNA in the livers of WKY and SHRSP. Relative hnRNA levels of MPD were quantified using β-actin as an internal control. Values are the means ± SD of four independent experiments.