
Figures & data
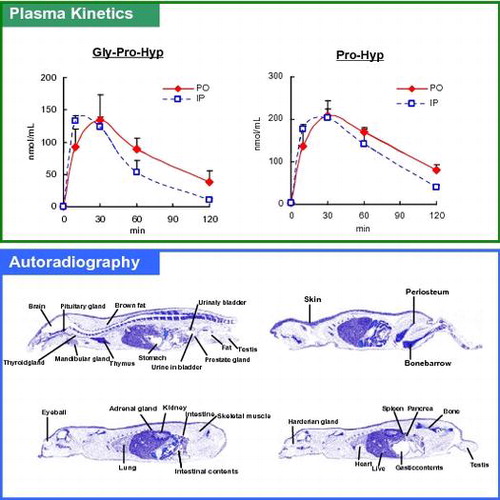
Fig. 1. Plasma levels of tripeptides and dipeptides after proral or intraperitoneal administration of CTP.
Notes: (A) Gly-Pro-Hyp, (B) Gly-Pro-Ala, (C) Gly-Ala-Hyp, (D) Pro-Hyp, (E) Gly-Pro, (F) Pro-Ala, (G) Ala-Hyp, and (H) Hyp-Gly. Values presented as the mean ± standard error, n = 5 subjects. Symbols: p.o.(◆), i.p.(□).
Table 1. AUC, Cmax, and Tmax of tripeptides and dipeptides in plasma after peoral administration of CTP.
Fig. 2. Whole-body autoradiographs 24hr after a single oral administration of Gly-[3H]Pro-Hyp to a fasting male rat.
Notes: Autradiographs of orally administrated Gly-[3H]Pro-Hyp to rat. The dose was 0.35 mmol/kg (74 MBq/kg).
![Fig. 2. Whole-body autoradiographs 24hr after a single oral administration of Gly-[3H]Pro-Hyp to a fasting male rat.Notes: Autradiographs of orally administrated Gly-[3H]Pro-Hyp to rat. The dose was 0.35 mmol/kg (74 MBq/kg).](/cms/asset/ed9a9494-c092-4439-964b-f42e44cd52d3/tbbb_a_1062711_f0002_b.gif)