Figures & data
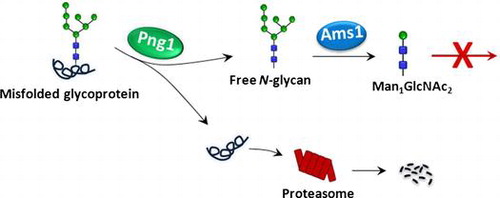
Fig. 1. Processing/degradation pathways for N-glycoproteins in the ER and cytosol of S. cerevisiae.Citation3,4)
Notes: In the ER lumen, oligosaccharyltransferase (OST) transfers the 14-mer glycan, Glc3Man9GlcNAc2, en bloc from their dolichylpyrophosphate-linked precursors (DLP) to the target proteins forming N-glycoproteins (step 1). ER glucosidase-1 (Gls1) and glucosidase-2 (Gls2) rapidly remove all of the glucose molecules followed by the action of ER mannosidase-1 (Mns1) which removes one mannose molecule from the glycans (steps 2–4). The mature glycoproteins are then delivered to their site of action whereas the terminally misfolded glycoproteins are retained in the ER and Htm1, another ER α-mannosidase, removes one more mannose, allowing for the specific sorting of the misfolded glycoproteins from the folded ones, and for the retrotranslocation of misfolded glycoproteins back to the cytosol through the retrotranslocon. In the cytosol, Png1 detaches the N-glycans from the misfolded glycoproteins producing the FNGs (steps 5–7).Citation6,7) The proteins are degraded by proteasomes. The pathway constitutes >95% of the FNG generation pathway.Citation7) FNGs are also liberated by the OST in the ER as a minor pathway (<5%) (step 8),Citation9) and are believed to be processed similarly by the ER glycosidases and transported to the cytosol (steps 9–12).Citation9) The only α-mannosidase in the cytosol, Ams1, trims the FNGs down to Man1GlcNAc2 (step 13).Citation6−8)
Fig. 2. Identification and characterization of Man1GlcNAc2-PA.
Notes: (A) Size-fractionation HPLC profile of the FNGs derived from WT cells at the log, post-diauxic, and stationary phases. The arrowheads indicate the elution position of PA-glucose oligomer for elution standards. Man1GlcNAc2; HPLC profile of the authentic Man1GlcNAc2-PA. (B) Reversed-phase HPLC profile of the peak f (top) and that of the authentic Man1GlcNAc2-PA (bottom).
Fig. 3. Man1GlcNAc2 as well as total FNGs continuously accumulate under prolonged culture conditions.
Note: Amounts of the Man1GlcNAc2 and total FNGs at the different growth phases are shown.
Fig. 4. Reduction of Man1GlcNAc2 in STL is only due to cell division.
Notes: (A) Size-fractionation HPLC profile of FNGs in STL. Position of Man1GlcNAc2 has been indicated by an arrow. (B) Change of cell concentration during the STL culture. (C) Quantified and calculated amounts of Man1GlcNAc2 in STL. The calculated value is the amount of Man1GlcNAc2 which is assumed to remain after its reduction caused by cell division. The value was calculated as described in “Materials and methods.”