1,045
Views
3
CrossRef citations to date
0
Altmetric
Biochemistry & Molecular Biology

Characterization of two endoglucanases for the classification of the earthworm, Eisenia fetida Waki

, , , , , , & show all
Pages 55-66 | Received 04 Feb 2015, Accepted 08 Jul 2015, Published online: 21 Aug 2015

Figures & data

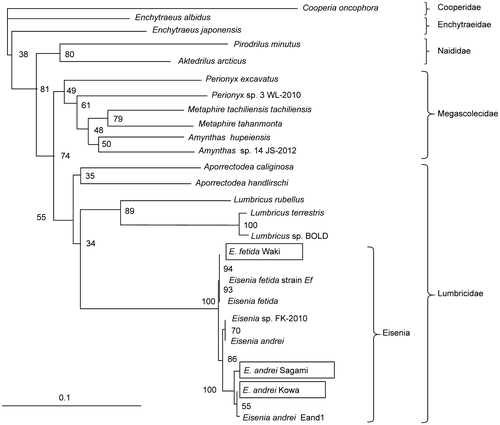
Fig. 1. Phylogenetic analysis of the COI region in earthworms.

Notes: The COI sequences were retrieved by the BLAST program using several databases. Multiple alignment was carried out using Clustal W, and a phylogenetic tree was constructed using neighbor joining by TreeView. The reliability of cluster formation was analyzed by bootstrap resampling 100 times, and the tree was generated with C. oncophora COI serving as the out-group. The scale bar represents the number of changes per nucleic acid position.
Fig. 1. Phylogenetic analysis of the COI region in earthworms.

Fig. 2. Morphology and cut parts of E. fetida Waki.

Fig. 2. Morphology and cut parts of E. fetida Waki.

Table 1. Enzyme activity of crude extract from each segment of E. fetida Waki.

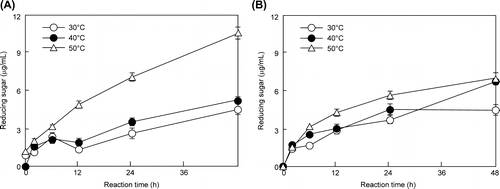
Fig. 3. Enzymatic saccharification with E. fetida Waki (A) and T. reesei QM9414 (B) cell-free extracts.

Notes: Wheat bran was used as a substrate. The reducing sugar was determined by the Somogyi–Nelson method. The reaction mixture included 1.0 g wheat bran and 30 units of CMCase equivalent. The white circles, black circles, and triangles represent 30, 40, and 50 °C, respectively.
Fig. 3. Enzymatic saccharification with E. fetida Waki (A) and T. reesei QM9414 (B) cell-free extracts.

Fig. 4. Detection of saccharification products in E. fetida Waki (A) and T. reesei QM9414 (B).

Notes: Wheat bran enzymatic saccharification products were determined using high-performance liquid chromatography. The white circles, black circles, white triangles, black triangles, white squares, black squares, and crosses represent xylose, glucose, arabinose, mannose, maltose, and cellobiose products, respectively.
Fig. 4. Detection of saccharification products in E. fetida Waki (A) and T. reesei QM9414 (B).

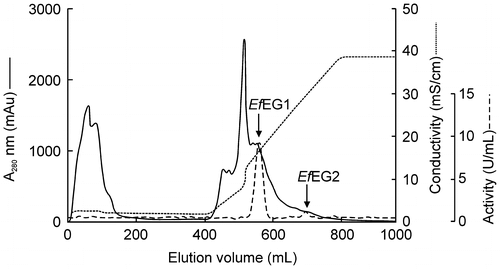
Fig. 5. Elution profile of EG isozymes in E. fetida Waki from the DEAE-Toyopearl column.

Note: CMC (1.0%) was used as a substrate.
Fig. 5. Elution profile of EG isozymes in E. fetida Waki from the DEAE-Toyopearl column.

Table 2. Elution profile of EG isozymes in E. fetida Waki from a DEAE-Toyopearl column.

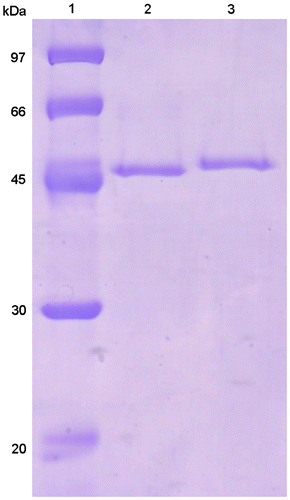
Fig. 6. SDS-PAGE of purified EfEG1 and EfEG2.

Notes: Lane 1, standard proteins; lane 2, EfEG1; lane 3, EfEG2. Standard proteins were phosphorylase b (97 kDa), albumin (66 kDa), ovalbumin (45 kDa), carbonic anhydrase (30 kDa), and trypsin inhibitor (20 kDa) (all from GE Healthcare). The protein was stained with Coomassie Brilliant Blue R-250 (Sigma-Aldrich).
Fig. 6. SDS-PAGE of purified EfEG1 and EfEG2.

Fig. 7. Effect of pH on the activity (A) and stability (B) of EfEG1 and EfEG2.

Notes: Enzyme activity was measured using the following buffers: 0.1 M McIlvaine buffer (pH 2.2–8.0) and glycine–NaOH buffer (pH 8.0–12.0). CMC (1.0%) was used as a substrate. The white circles and black circles represent EfEG1 and EfEG2 activity, respectively.
Fig. 7. Effect of pH on the activity (A) and stability (B) of EfEG1 and EfEG2.

Fig. 8. Effect of temperature on the activity (A) and thermostability (B) of EfEG1 and EfEG2.

Notes: Enzyme activity was measured using 25 mM sodium phosphate buffer (pH 7.0). CMC (1.0%) was used as a substrate. The white circles and black circles represent EfEG1 and EfEG2 activity, respectively.
Fig. 8. Effect of temperature on the activity (A) and thermostability (B) of EfEG1 and EfEG2.

Table 3. Properties of EGs from animal and T. reesei QM9414.

Table 4. Substrate specificity of purified EfEG1 and EfEG2 from E. fetida Waki.

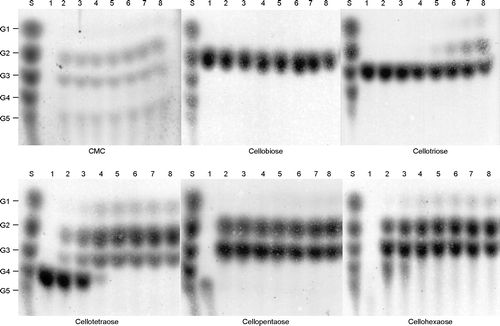
Fig. 9. TLC analysis of the reaction products of purified rEfEG1.

Notes: Lane 1, standard oligosaccharides; lane 2, reaction products for 0 min; lane 3, 15 min; lane 4, 30 min; lane 5, 1 h; lane 6, 3 h; lane 7, 6 h; lane 8, 12 h; lane 9, 24 h. Lane 1 indicates the standard oligosaccharides (G1, glucose; G2, cellobiose; G3, cellotriose; G4, cellotetraose; G5, cellopentaose).
Fig. 9. TLC analysis of the reaction products of purified rEfEG1.

Reprints and Corporate Permissions

Please note: Selecting permissions does not provide access to the full text of the article, please see our help page How do I view content?

To request a reprint or corporate permissions for this article, please click on the relevant link below:

Academic Permissions

Please note: Selecting permissions does not provide access to the full text of the article, please see our help page How do I view content?

Obtain permissions instantly via Rightslink by clicking on the button below:

If you are unable to obtain permissions via Rightslink, please complete and submit this Permissions form. For more information, please visit our Permissions help page.