Figures & data
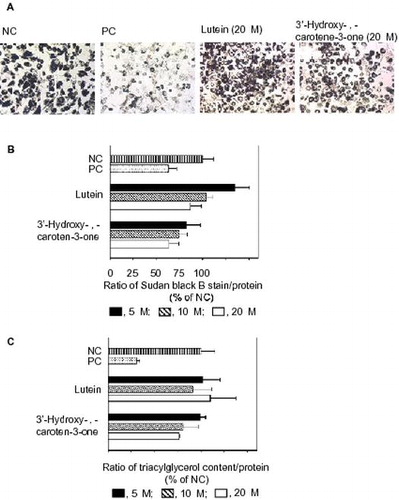
Fig. 1. Proposed metabolic transformation from lutein to 3′-hydroxy-ε,ε-caroten-3-one.
Fig. 2. Effects of lutein and 3′-hydroxy-ε,ε-caroten-3-one on the differentiation of 3T3-L1 cells to adipocytes.
Notes: 3T3-L1 cells were treated with a negative control (NC), 1 μg/mL (2.7 μM) berberine chloride as a positive control (PC), lutein, and 3′-hydroxy-ε,ε-caroten-3-one. (A) Microscopy of cells stained with Sudan Black B (×200). (B) Amounts of Sudan Black B extracted from the stained cells. The amounts were measured as lipid content by spectrophotometric analysis. (C) Triacylglycerol amounts in cells. The amounts were analyzed with a commercial kit. All data were corrected by the protein amounts. Data represent the means ± SD values of four wells of a single experiment. Replicate experiments showed a similar trend. Asterisks indicate values significantly different from the NC value (p < 0.05). Statistical comparisons were made by the Tukey−Kramer test.
Fig. 3. End group structures optimized by AM1 molecular orbital calculations.
(A) 3-Hydroxy β-end group found in lutein. (B) 3-Oxo ε-end group found in 3′-hydroxy-ε,ε-caroten-3-one.
Fig. 4. Amounts of carotenoid in the cells and medium.
Notes: Cells were treated with lutein and 3′-hydroxy-ε,ε-caroten-3-one. (A) Amounts of carotenoid in 3T3-L1 cells. Values not sharing a common letter are significantly different by the Tukey−Kramer test p < 0.05). Replicate experiments showed a similar trend. (B) Amounts of residual carotenoid in medium after the second treatment with carotenoid at 20 μM. Data were corrected by the protein amounts and are shown as the means ± SD of four wells of a single experiment. Replicate experiments showed a similar trend. The asterisk indicates a value with significant difference by Student’s t-test p < 0.05).