
Figures & data
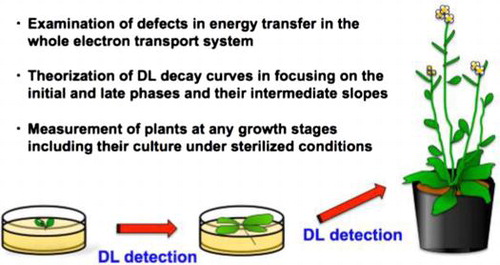
Fig. 1. Front view of the experimental setup used to measure DL.
Fig. 2. First and second detections of DL decay curves after excitation.
Notes: A, Schematic representation of the detection sequence. B, DL decay curves were recorded for 300 s (5 min) followed by a 30-s excitation of Chl molecules with 45 μmol photons m−2 s−1 light at 695 nm. After an additional 5-min incubation in the dark, a second detection was performed with a 30-s excitation. The downward arrow indicates the convexity, and the upward arrow indicates the concavity.
Fig. 3. DL decay curves of Arabidopsis at different growth stages.
Notes: A, Plants at 2–4 weeks old that were used for DL detection, bar = 1 cm. DL decay curves of 2-week-old plants B, 3-week-old plants C, and 4-week-old plants D. E, Differences in initial DL intensities of the first and second detections among 2- to 4-week-old plants.
Fig. 4. DL decay curves of plants grown under different light intensities for 2 weeks.
Notes: A, Plants grown under 15 μmol photons m−2 s−1 (μE); B, 45 μE; C, 120 μE. D, Differences in initial DL intensities of the first and second detections among plants grown under 15, 45, or 120 μE light intensities.
Fig. 5. Influence of 10 μM DCMU, DBMIB, and antimycin A on DL decay curves, ETR, and NPQ.
Notes: A, Delayed luminescence curves of non-treated plants; B, 0.1% DMF (solvent alone)-treated plants; C, DCMU-treated plants; D, DBMIB-treated plants; E, antimycin A-treated plants. Purple circles indicate the differences in initial DL intensities, and purple arrows show the characteristic convexity (the downward arrow) and concavity (the upward arrow). The purple dotted lines show DL intensities at 10 s, when attention should be paid to the slopes of the decay curves in the first detection. F, Differences in initial DL intensities between the first and second detections of non-treated and photosynthetic electron transport inhibitor-treated plants. G, Relationship between light intensity and ETR. H, NPQ of plants treated with different inhibitors. SEM is the standard error of the mean, which was obtained from three separate experiments.
Supplemental material