Figures & data
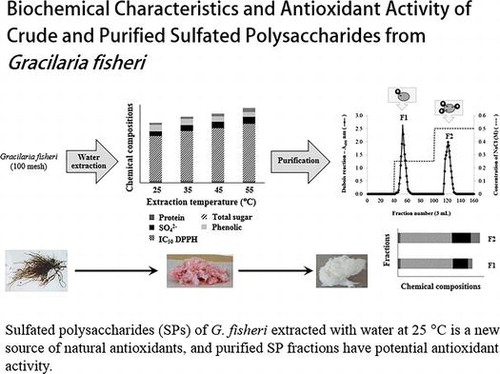
Fig. 1. Schematic diagram of the extraction and purification of SP extracts from Gracilaria fisheri.
Table 1. Extraction yield, chemical compositions, and scavenging of the DPPH free radical by crude SP extracts obtained from Gracilaria fisheri with water extraction at different temperatures.
Fig. 2. TLC analysis of the monosaccharide composition in crude (A), and purified (B) SP extracts from Gracilaria fisheri.
Notes: Crude SP extracts were purified, hydrolyzed with sulfuric acid, autoclaved, and analyzed by TLC. Crude SPs were obtained at 25 and 55 °C. The purified fractions of SPs were obtained from anion-exchange chromatography on a Toyopearl DEAE-650M column of crude SP (25 °C). G, standard glucose oligosaccharides (G1-G6); X, standard xylose oligosaccharides (X1-X6); Glu, standard glucose; Ga, standard galactose; 1, acid-treated SP (25 °C); 2, acid-treated SP (55 °C); F1 and F2, acid-treated purified fractions of F1 and F2, respectively.
Table 2. Pearson’s correlation coefficients (r) of antioxidant activity against DPPH and chemical compositions, phenolic compound, sulfate, total sugar, and protein.
Fig. 3. Anion-exchange chromatography of the crude SP extract (25 °C) obtained from Gracilaria fisheri on a Toyopearl DEAE 650 M column.