Figures & data
Table 1. Treatment procedure of different groups of tall fescue seedlings.
Fig. 1. The procedure of the preparation of plant cell wall materials (a) and sequential extraction of cell wall polysaccharide (b).
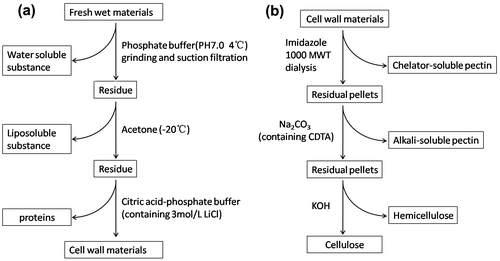
Table 2. Effects of He–Ne laser irradiation on plant growth and development.
Fig. 2. ROS level (a, H2O2 relative content; b, the generation rate of O2•−) and MDA contents (c) in tall fescue seedlings under He–Ne laser irradiation and salt stress.
Notes: Data are presented as the means ± SD from five independent experiments (n = 5). Different letters followed with bars indicate significant differences at p < 0.05 according to Duncan’s multiple range test. CK: controls without any stress treatment; H2, H4, H6: He–Ne laser illumination alone for 2, 4, and 6 min d−1 under normal conditions, respectively; N: salt stress (150 mM) for 10 d; N+H2, N+H4, N+H6: He–Ne laser illumination for 2, 4, and 6 min d−1 prior to salt stress.
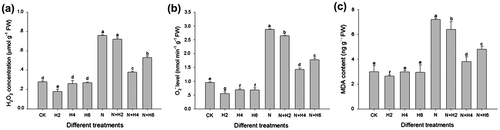
Fig. 3. Effects of salt stress and He–Ne laser irradiation on cell viability with trypan blue staining assay kit in tall fescue seedlings (a–d, i–l: root tissues; e–h, m–p: leaf tissues).
Notes: CK: controls without any stress treatment; H2, H4, H6: He–Ne laser illumination alone for 2, 4, and 6 min d−1 under normal conditions, respectively; N: salt stress (150 mM) for 10 d; N+H2, N+H4, N+H6: He–Ne laser illumination for 2, 4, and 6 min d−1 prior to salt stress. 10×, bar = 500 μm.
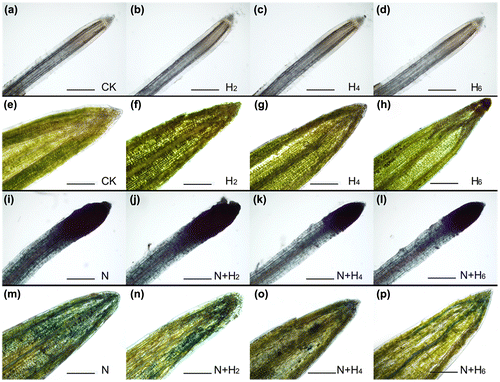
Fig. 4. The agarose gel electrophoresis analysis and the completed genomic DNA relative contents determination in leaves and roots of tall fescue seedlings (a,c, leaf tissues; b,d, root tissues).
Notes: The results of agarose gel electrophoresis analysis (a, leaf tissues; b, root tissues). M: DNA marker; 1: controls without any stress treatment; 2, 3, 4: He–Ne laser illumination alone for 2, 4, and 6 min d−1 under normal conditions, respectively; 5: salt stress (150 mM) for 10 d; 6, 7, 8: He–Ne laser illumination for 2, 4, and 6 min d−1 prior to salt stress, respectively. The completed genomic DNA relative contents (c, leaf tissues; d, root tissues) according to signal strength of DNA on the agarose gel. Data are presented as the means ± SD from five independent experiments (n = 5). Different letters followed with bars indicate significant differences at p < 0.05 according to Duncan’s multiple range test. CK: controls without any stress treatment; H2, H4, H6: He–Ne laser illumination alone for 2, 4, and 6 min d−1 under normal conditions, respectively; N: salt stress (150 mM) for 10 d; N+H2, N+H4, N+H6: He–Ne laser illumination for 2, 4, and 6 min d−1 prior to salt stress.
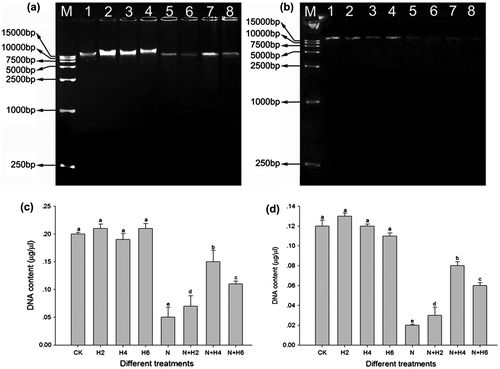
Fig. 5. Apopladder assay and DNA damage analysis under salt stress and He–Ne laser irradiation in leaves and roots of tall fescue seedlings (a, c, leaf tissues; b, d, root tissues).
Notes: The results of agarose gel electrophoresis analysis (a, leaf tissues; b, root tissues). M: 1 kb DNA ladder marker; 1: controls without any stress treatment; 2, 3, 4: He–Ne laser illumination alone for 2, 4, and 6 min d−1 under normal conditions, respectively; 5: salt stress (150 mM) for 10 d; 6, 7, 8: He–Ne laser illumination for 2, 4, and 6 min d−1 prior to salt stress, respectively. Relative DNA “smear” degree (c, leaf tissues) and DNA “laddering” degree (d, root tissues). Data are presented as the means ± SD from five independent experiments (n = 5). Different letters followed with bars indicate significant differences at p < 0.05 according to Duncan’s multiple range test. CK: controls without any stress treatment; H2, H4, H6: He–Ne laser illumination alone for 2, 4, and 6 min d−1 under normal conditions, respectively; N: salt stress (150 mM) for 10 d; N+H2, N+H4, N+H6: He–Ne laser illumination for 2, 4, and 6 min d−1 prior to salt stress.
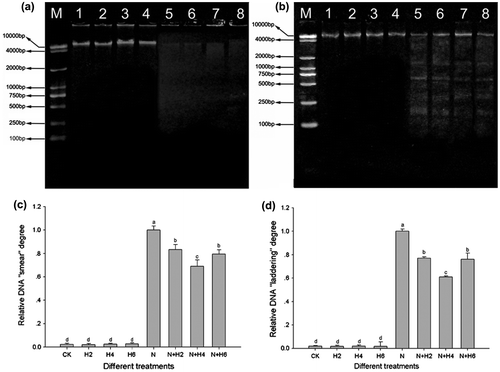
Table 3. Effects of He–Ne laser irradiation on the monosaccharide composition proportions of cell wall polysaccharide of tall fescue seedlings.
Fig. 6. The FTIR spectra analysis of cell wall polysaccharides (a, e, the chelating pectin fraction; b, f, the alkali-soluble pectin fraction; c, g, hemicelluloses; d, h, celluloses) from leaves (a–d) and roots (e–h) materials of tall fescue seedlings.
Notes: CK: controls without any stress treatment; H: He–Ne laser illumination alone for 4 min d−1 under normal conditions; N: salt stress (150 mM) for 10 d; N+H: He–Ne laser illumination for 4 min d−1 prior to salt stress.
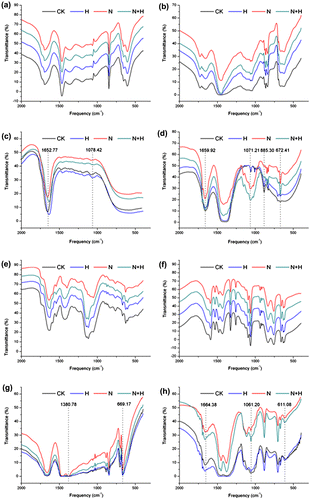
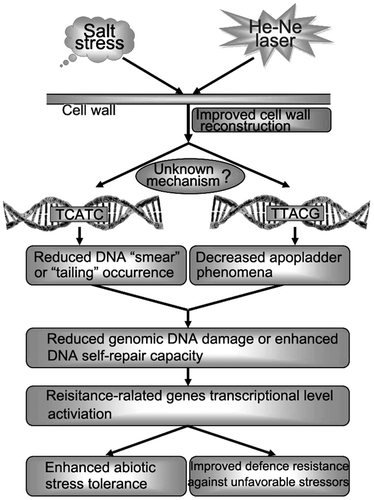
Fig. 7. Schematic of a putative mechanism through which cell wall polysaccharides are protected against physicochemical damages induced by salt stress that result in plant cell wall structure reconstruction.